Universal Analytics shut down on July 1, 2024. Google deleted all remaining Universal Analytics properties on July 1, 2025, including every piece of historical data. If you haven’t migrated to Google Analytics 4 yet, you’re operating blind—making marketing decisions without data to back them up.
This complete guide walks you through GA4 setup from account creation to first insights. You’ll learn exactly what to track, how to verify everything works correctly, and which settings need immediate configuration. Whether you run a local business website, manage an e-commerce store, or handle marketing for a service company, you’ll have working analytics collecting accurate data by the end of this tutorial.
The transition to GA4 isn’t optional anymore. It’s the only version of Google Analytics available. Every day without tracking means lost insights you’ll never recover.
Table of Contents
What Is Google Analytics 4 (And Why You Need It Now)
Google Analytics 4 is Google’s web analytics platform that replaced Universal Analytics in July 2024. It tracks every user interaction as individual events rather than sessions, provides cross-platform measurement for websites and apps, and uses machine learning to predict user behavior and fill data gaps when tracking is limited.
The platform shows you where visitors come from, what they do on your site, which pages perform best, and where people abandon their journey. This information helps you improve user experience, optimize marketing spend, fix broken conversion paths, and grow revenue through informed decisions.
GA4 works differently from its predecessor. The event-based model gives you more granular data about specific user actions. You can track button clicks, form submissions, video plays, scroll depth, and purchases as individual events with custom parameters. This flexibility makes GA4 more powerful but requires more careful initial setup.
The platform includes privacy-first features that matter as third-party cookies disappear. GA4 can model data when users opt out of tracking, predict revenue from incomplete data, and measure campaigns without personally identifying individuals. These capabilities keep analytics useful in a privacy-focused world where traditional tracking methods fail.
Most small businesses resist GA4 because it looks complicated. The interface differs significantly from Universal Analytics. The terminology changed. The reports reorganized. But complexity isn’t a valid excuse for operating without data. Your competitors already installed GA4 and are using insights to outperform you.
What Happened to Universal Analytics (And Why GA4 Is Your Only Option)
Universal Analytics stopped collecting data on July 1, 2024. Google deleted all Universal Analytics properties exactly one year later on July 1, 2025. Historical data, seasonal trends, year-over-year comparisons, and baseline metrics—all deleted permanently.
The transition wasn’t optional. Google forced the migration because Universal Analytics couldn’t handle modern tracking needs. Session-based measurement made sense when people used one device, but cross-device journeys broke the model. Privacy regulations required new approaches that Universal Analytics couldn’t deliver. Machine learning and predictive analytics needed event-level data that the old platform didn’t collect.
Millions of websites lost historical data because they delayed migration. The most common reason was fear—business owners worried about breaking their sites or tracking things wrong. The second most common reason was misunderstanding the deadline. Many believed their data would transfer automatically or remain accessible after shutdown.
Neither happened. GA4 and Universal Analytics are completely separate platforms. They don’t share data, can’t import from each other, and require independent setup. Sites that installed GA4 late started with zero historical context. Sites that never migrated now operate blind, making decisions without data.
Three years of historical data vanished for businesses that waited. Three years of seasonal patterns showing which months drive the most revenue. Three years of traffic source data revealing which marketing channels actually work. Three years of user behavior insights identifying what content converts visitors into customers.
You can’t delay anymore. GA4 is the only Google Analytics option available. Every day without tracking means lost insights you’ll never recover. Install it today, not next week.
Before You Start: What You Need for GA4 Setup
You need three things before beginning GA4 setup: a Google account, access to your website’s code or admin panel, and 30 minutes of uninterrupted time.
Google Account: Use an account that will remain accessible long-term. Many businesses use a shared company account (analytics@company.com) rather than personal emails that might leave when employees change roles. Don’t use temporary or trial email addresses. The email you choose owns your GA4 property and all historical data.
Website Access: You need ability to add code to your site or install plugins. For WordPress, this means admin access to the dashboard. For custom websites, you need FTP access or developer support. For platforms like Shopify, Wix, or Squarespace, admin access is sufficient since they offer built-in GA4 integration.
Time: Complete setup in one session if possible. Partial installations create confusion when you return later and can’t remember which step you completed. Block 30-45 minutes without distractions. Close Slack. Silence your phone. Focus completely on getting this done right the first time.
Check if anyone else in your organization already created a GA4 property. Multiple people creating separate properties for the same website causes data fragmentation. One person visits your site and triggers tracking in three different GA4 properties, making all your data inaccurate. Ask your team before starting fresh.
Gather these details before beginning:
- Your website’s primary domain (example.com)
- Your business timezone (affects when days begin/end in reports)
- Your primary business currency (affects revenue reporting)
- Your business industry category (helps Google suggest relevant features)
- List of anyone who needs access to analytics data
Having this information ready makes setup faster and prevents mistakes that require starting over.
How to Create Your GA4 Property (Step-by-Step)
Creating a GA4 property takes about 5 minutes and requires a Google account. You’ll name your property, select your timezone and currency, provide basic business information, and create your first data stream to get a measurement ID.
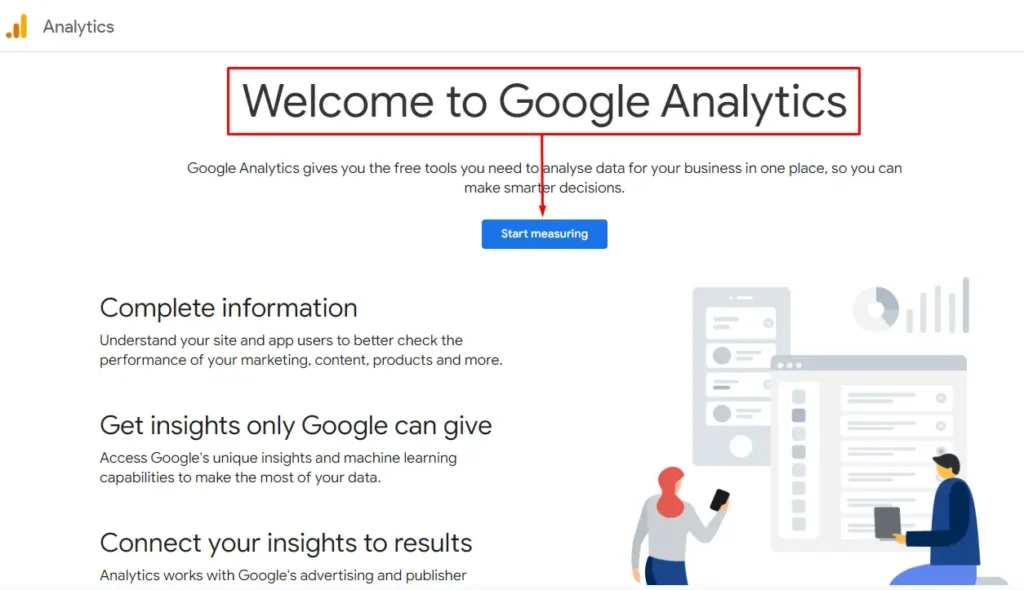
Go to analytics.google.com and sign in with your Google account. Click “Start measuring” if this is your first time, or “Admin” then “Create Property” if you already use Google Analytics for other sites.
Step 1: Account Setup
Name your account something memorable. Most businesses use their company name here. The account acts as a container for properties, so if you manage multiple websites, you’ll create separate properties within this account.
Select your country and choose data-sharing preferences. These settings determine what information Google can use to improve their products and provide benchmarks. Most businesses leave these enabled, but review if your industry has specific privacy requirements.
Click “Next” to continue to property setup.
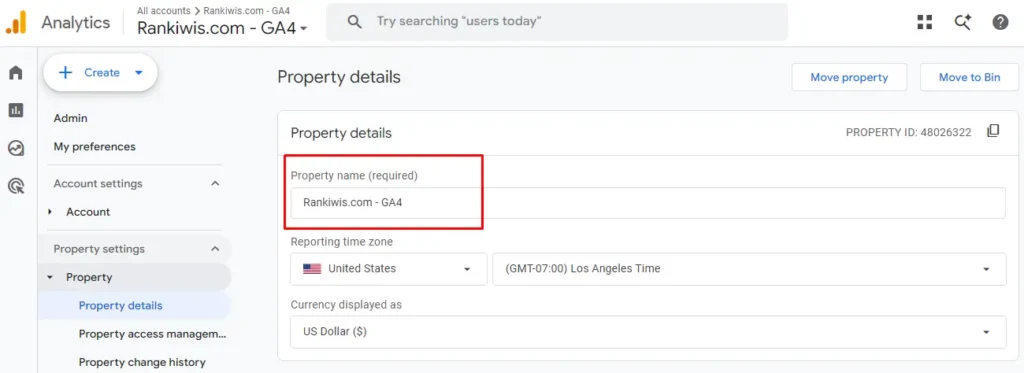
Step 2: Property Details
Name your property. Use your website name or a description that clearly identifies what you’re tracking. “Main Website,” “E-commerce Store,” or your actual domain name all work well. Avoid generic names like “Property 1” since these become confusing when you manage multiple sites.
Select your reporting timezone carefully. This determines when days begin and end in your reports. Choose the timezone where your business operates or where most users are located. This setting cannot be changed after property creation, so consider carefully before proceeding.
Choose your currency. This affects how revenue appears in e-commerce reports. Select the currency you actually use for transactions. If you operate internationally, pick your primary business currency. You can change currency later if needed, but the timezone is permanent.
Click “Next” to continue.
Step 3: Business Information
Select your industry category from the dropdown menu. This helps Google provide relevant templates and insights. Choose the closest match even if not perfect. Options include retail, finance, technology, real estate, healthcare, and dozens of others.
Select your business size. Options include small (1-10 employees), medium (11-100), large (101-500), and enterprise (501+). This helps Google customize the interface and suggest relevant features for your company size.
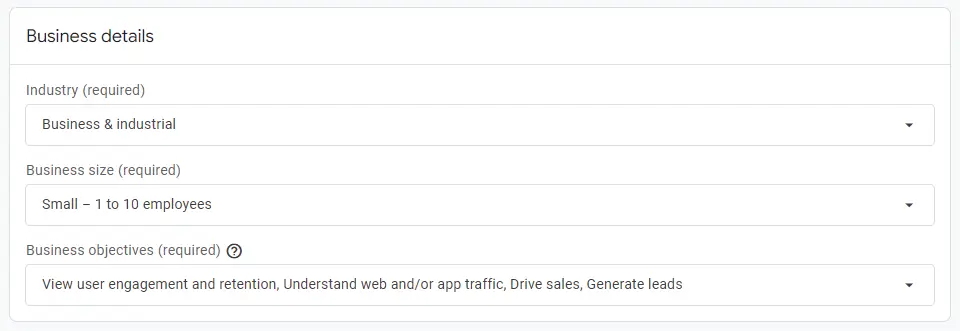
Choose your business objectives. Options include “Examine user behavior,” “Measure advertising ROI,” “Get baseline reports,” and others. Select all that apply. These selections influence which reports appear in your interface by default. You can change reports later, so don’t overthink this decision.
Click “Create” and accept the Terms of Service agreement. Read through the agreement and check the box confirming you accept Google’s terms.
Step 4: Data Collection Setup
Google asks how you want to start collecting data. Select “Web” if you’re tracking a website. Choose “iOS app” or “Android app” if tracking mobile applications. This tutorial focuses on website tracking.
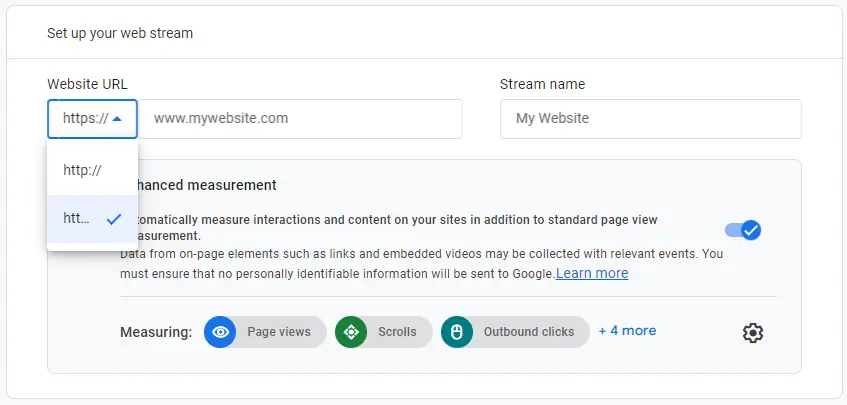
Enter your website URL. Include “https://” and use your primary domain. Don’t add “www” if your site works without it. If your site uses www.example.com, include the www. If it uses example.com without www, omit it.
Name your data stream. Most people use “Website” or their domain name. Data streams represent individual data sources, so descriptive names help when you add mobile apps or additional websites later.
Click “Create stream.”
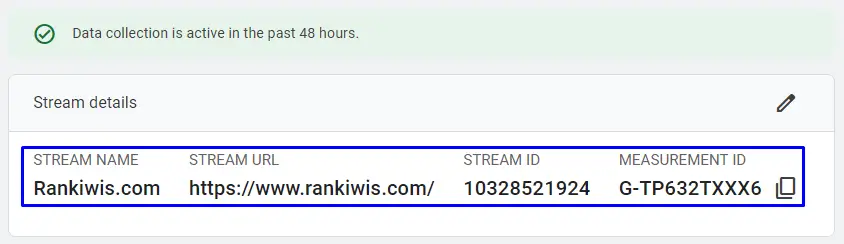
Google generates your Measurement ID. This is a code that starts with “G-” followed by 10 characters (example: G-ABC1234567). You need this ID to install tracking on your website. The measurement ID connects your website to your GA4 property and tells Google where to send your analytics data.
Copy the Measurement ID and keep it accessible. You’ll use it in the next section to install tracking. Don’t close this browser tab yet—you might need to reference these settings.
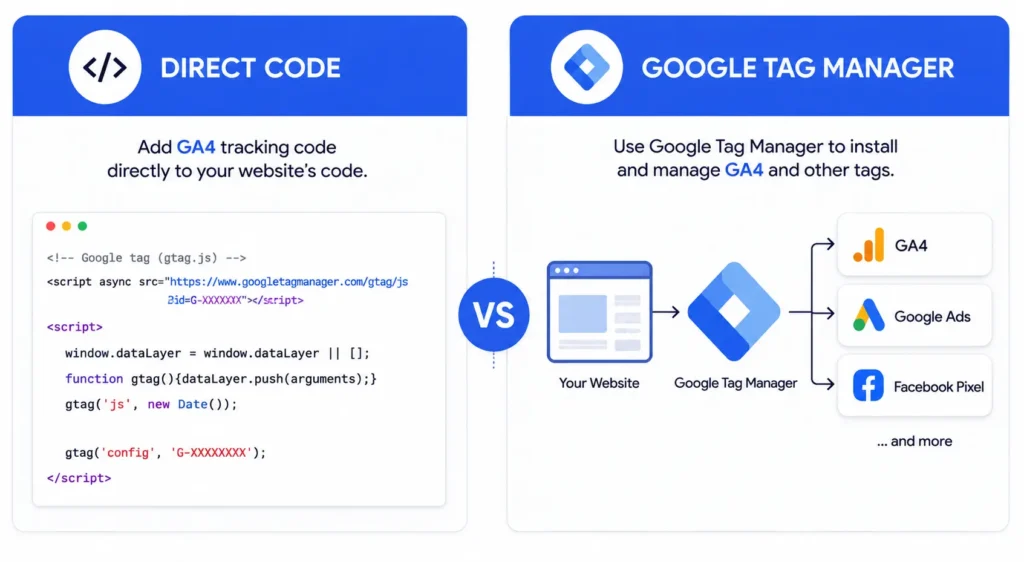
How to Install GA4: Direct Code vs Google Tag Manager
You can install GA4 two ways: paste Google’s tracking code directly into your website’s HTML, or use Google Tag Manager. Google Tag Manager is recommended because it lets you manage all tracking tags in one place, add new tracking without editing code, and test changes before publishing them live.
Should You Use Google Tag Manager or Direct Installation?
Use Google Tag Manager if:
- You plan to track events beyond basic page views
- You want to add tracking for other tools (Facebook Pixel, Google Ads conversion tracking)
- You need to test tracking changes before going live
- Multiple people need to manage tracking
- You’re not comfortable editing website code repeatedly
- You anticipate changing or adding tracking frequently
Use direct installation if:
- You only need basic page view tracking forever
- Your site has extremely simple tracking needs
- You prefer fewer tools in your stack
- A developer handles all code changes for you anyway
- You never plan to track custom events or conversions
Most growing businesses benefit from Google Tag Manager. The initial setup takes slightly longer (45 minutes vs 20 minutes), but managing tracking becomes dramatically easier afterward. Adding new tracking takes 5 minutes in GTM versus hours of developer time for direct code edits.
Method 1: Installing GA4 with Direct Code (Quick Method)
Direct installation means pasting Google’s tracking code into your website’s HTML. This works but makes future changes harder since you’ll edit code every time you add tracking.
In your GA4 property, go to Admin > Data Streams > Web. Click your data stream and scroll to “Tagging Instructions.” Click “Add new on-page tag” and select “Install manually.”
Copy the entire code block. It looks like this:
<!-- Google tag (gtag.js) -->
<script async src="https://www.googletagmanager.com/gtag/js?id=G-XXXXXXXXXX"></script>
<script>
  window.dataLayer = window.dataLayer || [];
  function gtag(){dataLayer.push(arguments);}
  gtag('js', new Date());
  gtag('config', 'G-XXXXXXXXXX');
</script>
Paste this code into the <head> section of every page on your website. The code must appear on all pages for complete tracking.
For WordPress sites: Install the “Site Kit by Google” plugin, “MonsterInsights,” or any Google Analytics plugin. Enter your Measurement ID (the G-XXXXXXXXXX part) in the plugin settings. The plugin adds the code automatically to all pages. Site Kit is Google’s official plugin and integrates with other Google services.
For Shopify sites: Go to Online Store > Themes > Actions > Edit Code. Open theme.liquid and paste the code immediately after the opening <head> tag. Save the file. The theme.liquid file controls your site’s global template, so adding code here affects all pages.
For Wix, Squarespace, Webflow: These platforms have built-in GA4 integration. Go to your site’s analytics or integrations settings, paste your Measurement ID, and save. The platform handles code installation automatically. Check your platform’s documentation for the exact location of analytics settings.
For custom websites: Add the code to your site’s header template file. This file usually controls the <head> section across all pages. Common filenames include header.php, head.php, or _header.html depending on your technology stack. If you’re unsure which file to edit, ask your developer.
After adding the code, save changes and proceed to the verification section below. Wait 24 hours before expecting full data in standard reports, though Realtime reports should show activity within minutes.
Method 2: Installing GA4 with Google Tag Manager (Recommended)
Google Tag Manager (GTM) is a free tool that manages all your tracking codes from one interface. You install GTM once on your website, then add or modify tracking without touching your website’s code again. This separation of tracking from website code prevents tracking issues from breaking your site.
Step 1: Create a GTM Account
Go to tagmanager.google.com and sign in with your Google account. Use the same account you used for GA4 to keep everything organized.
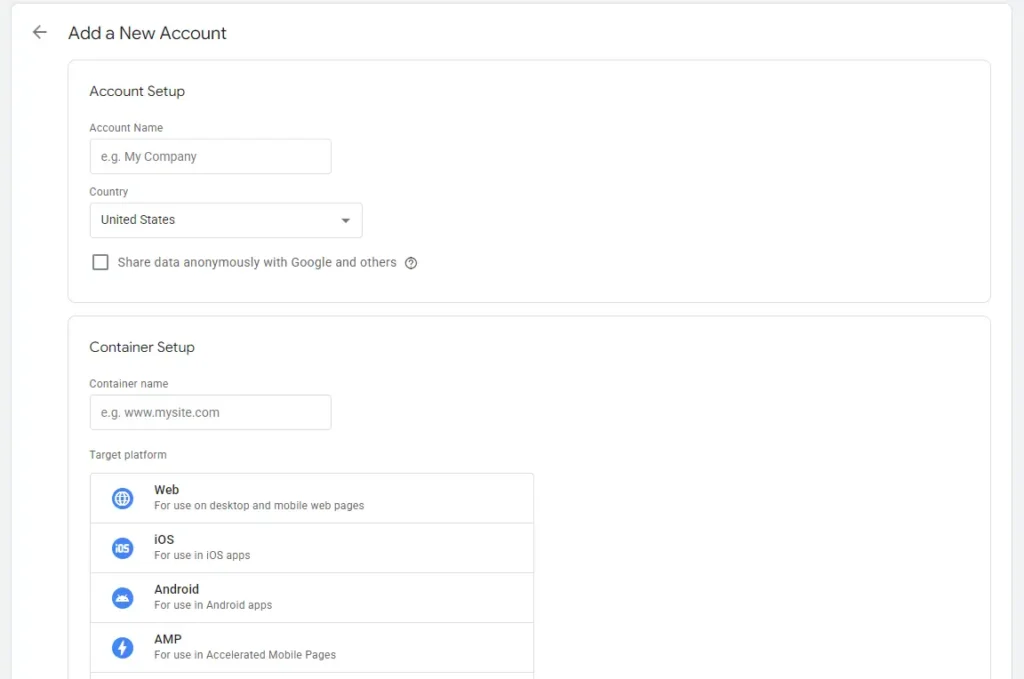
Click “Create Account” and name your account (typically your company name). Select your country.
Under “Container setup,” enter your website URL as the container name. Select “Web” as the target platform. Don’t select “AMP” unless you specifically use AMP (Accelerated Mobile Pages) technology. Click “Create” and accept the Terms of Service.
Google displays two code snippets. Keep this window open—you need these codes next.
Step 2: Install GTM on Your Website
<!-- Google Tag Manager -->
<script>(function(w,d,s,l,i){w[l]=w[l]||[];w[l].push({'gtm.start':
new Date().getTime(),event:'gtm.js'});var f=d.getElementsByTagName(s)[0],
j=d.createElement(s),dl=l!='dataLayer'?'&l='+l:'';j.async=true;j.src=
'https://www.googletagmanager.com/gtm.js?id='+i+dl;f.parentNode.insertBefore(j,f);
})(window,document,'script','dataLayer','GTM-KGCXXXL9');</script>
<!-- End Google Tag Manager -->
Copy the first code snippet (the one that includes <head>). Paste this code into your website’s <head> section, as high as possible. The higher in the head section, the earlier GTM loads, which improves tracking accuracy.
<!-- Google Tag Manager (noscript) -->
<noscript><iframe src="https://www.googletagmanager.com/ns.html?id=GTM-KGCXXXL9"
height="0" width="0" style="display:none;visibility:hidden"></iframe></noscript>
<!-- End Google Tag Manager (noscript) -->
Copy the second code snippet (the one that includes <body>). Paste this immediately after the opening <body> tag on every page. This code serves as a backup if JavaScript is disabled in a user’s browser.
For WordPress sites: Install the “GTM4WP” (Google Tag Manager for WordPress) plugin or “Insert Headers and Footers” plugin. Enter your GTM container ID (starts with “GTM-“) in the plugin settings. GTM4WP is specifically designed for WordPress and includes helpful features for WooCommerce tracking. The plugin adds both code snippets automatically to the correct locations.
For other platforms: Follow the same process as direct code installation above, but paste the GTM snippets instead of the GA4 code. Most website builders support GTM natively through their integrations settings. Search your platform’s help documentation for “Google Tag Manager integration.”
Step 3: Add GA4 to Google Tag Manager
In Google Tag Manager, click “Tags” in the left sidebar, then “New.“
Click the tag configuration area (the large box that says “Choose a tag type to begin setup…”). Select “Google Tag” from the list. If you see “Google Analytics: GA4 Configuration” instead, select that—Google is transitioning naming but both work identically.
In the “Tag ID” field, paste your GA4 Measurement ID (G-XXXXXXXXXX). This connects the tag to your GA4 property.
Click the “Triggering” section below the tag configuration. Select “Initialization – All Pages.” This makes GA4 track every page on your site and ensures the tag fires before other tags that might depend on GA4.
Name your tag something clear like “GA4 – Configuration” or “Google Analytics 4 – Base Tag” and click “Save.”
Click “Submit” in the top right corner to publish your changes. Name this version “Initial GA4 Setup” and add a description like “First GA4 implementation via GTM.” Click “Publish.”
Your GA4 tracking is now live through Google Tag Manager. Every visitor to your site will trigger GA4 tracking.
How to Verify Your GA4 Installation Is Working
Broken tracking means lost data you’ll never recover. Verify your installation immediately after setup using either the Realtime report or DebugView. Don’t assume tracking works—confirm it works.
Verification Method 1: Realtime Report
The Realtime report shows activity from the last 30 minutes and provides the fastest confirmation that tracking works.
In GA4, go to Reports > Realtime in the left sidebar. Open your website in a new browser tab or on your phone. Within 30 seconds, you should see “1” active user appear in the Realtime report under “Users in the last 30 minutes.”
Navigate to different pages on your site. The report should show your page views updating in real-time. Check the “Event count by Event name” card—you should see “page_view” events incrementing as you browse.
If you see yourself in Realtime, your tracking works. If nothing appears after 2-3 minutes, proceed to troubleshooting below.
Verification Method 2: DebugView (More Detailed)
DebugView shows exactly what data GA4 receives event-by-event, making it better for diagnosing specific tracking issues. Use this method if Realtime shows activity but you want to verify data accuracy.
In GA4, go to Admin > DebugView in the left sidebar.
If using Google Tag Manager: Click “Preview” in the top right corner of GTM. Enter your website URL and click “Connect.” Your website opens in a new tab with Tag Assistant connected.
If using direct installation: Install the “Google Analytics Debugger” Chrome extension. Enable the extension, then browse your site.
Browse your website normally while watching DebugView in GA4. You should see a stream of events appearing: page_view, session_start, first_visit, and scroll events.
Click any event to see its parameters (page_location, page_referrer, page_title). These parameters should contain accurate information about your current browsing. For example, page_location should show the exact URL you’re viewing.
If events appear with correct data, your installation works properly. If events appear but data looks wrong (wrong URLs, missing parameters), your installation has configuration issues that need fixing.
Common Installation Issues and Fixes
Nothing appears in Realtime after 5 minutes:
- Check if you’re using an ad blocker. Ad blockers prevent GA4 tracking. Disable it or test in incognito mode with extensions disabled.
- Verify you pasted the Measurement ID correctly with no extra spaces or characters. A single typo breaks tracking completely.
- Confirm the tracking code appears on the page. Right-click your site, select “View Page Source,” and search for your Measurement ID.
- Check if you published changes in GTM. Unpublished workspaces don’t affect live sites. Look for “Workspace Changes” in GTM and click “Submit.“
- Clear your browser cache and reload the page. Cached versions might not include your new tracking code.
Realtime shows activity but DebugView is empty:
- DebugView requires debug mode enabled. In GTM, you must have Preview mode active. For direct installations, install the “Google Analytics Debugger” Chrome extension and enable it.
Events show but data looks wrong (incorrect URLs, duplicate events):
- Check your timezone settings in GA4 (Admin > Property Settings). Wrong timezone makes timestamps incorrect.
- Verify you’re testing on the correct website. If you copied setup from another site, you might be sending data to the wrong property.
- Confirm you didn’t install tracking twice. This doubles your numbers. Check page source for duplicate GA4 codes.
Can’t find the Realtime report:
- Go to Reports in the left sidebar, then look for Realtime. If it’s missing, you might be in the wrong property. Check the property selector at the top of the page showing your property name.
Give GA4 at least 24-48 hours to process data before evaluating standard reports. Realtime is instant, but other reports have processing delays. Don’t panic if Acquisition or Engagement reports look empty on day one.
Essential GA4 Settings to Configure Right Away
Several critical settings need immediate configuration. These settings can’t be applied retroactively, so change them before collecting significant data. Waiting even a few days to configure these means losing data or limiting future analysis capabilities.
Data Retention (Most Important – Cannot Be Retroactive)
GA4 defaults to keeping detailed user data for only 2 months. This severely limits your analysis capabilities. Change this immediately—it cannot be applied to data already collected.
Go to Admin > Data Settings > Data Retention in the left sidebar.
Change “Event data retention” from 2 months to 14 months. This is the maximum allowed on the free version. GA4 360 (paid version) allows longer retention.
Click “Save.”
This setting determines how long GA4 keeps user-level and event-level data for custom analysis. Standard reports aren’t affected and show historical data regardless of this setting. But Exploration reports, custom funnels, and audience building need this detailed data.
If you don’t change this setting, you can’t analyze user behavior older than 60 days. You can’t build audiences of users who visited specific pages in the last 90 days. You can’t create conversion funnels showing behavior from three months ago.
Most businesses discover this limitation months after setup when they try to build a year-over-year comparison and realize GA4 deleted the data they need. Don’t make this mistake.
Internal Traffic Filtering
Your own visits to your website skew data and make metrics inaccurate. Filter internal traffic to see real visitor behavior without contamination from your team.
Go to Admin > Data Settings > Data Filters. Click “Create Filter.”
Name it “Internal Traffic” and select “Internal Traffic” as the filter type. Leave the filter in “Testing” mode initially. Testing mode flags internal traffic without excluding it, letting you verify the filter works before permanently removing data.
Click “Create.”
Next, define what “internal traffic” means. Go to Admin > Data Streams > Web and click your data stream. Scroll to “Configure tag settings” and click “Show more.” Select “Define internal traffic.”
Click “Create” and add your IP address. You can find your current IP address by searching “what is my IP” in Google. Match type should be “IP address equals” and paste your IP in the value field.
Add multiple rules if you have office locations, remote workers, or other IP addresses that represent your team rather than customers. Click “Create” after adding each IP.
Wait 24-48 hours for the filter to collect data. Go back to Admin > Data Settings > Data Filters. Check if the filter captured your traffic correctly by looking at how many events were flagged as internal traffic. If the number seems reasonable, change the filter from “Testing” to “Active.”
Active filters permanently exclude matching traffic from your reports. Once activated, you can’t recover that data, so verify the filter works correctly in Testing mode first.
Google Signals (Optional – Privacy Considerations Apply)
Google Signals enables cross-device tracking and demographic reporting using Google account data. This provides richer insights but has privacy implications that require legal compliance.
Go to Admin > Data Collection in the left sidebar. Click “Get started” under Google Signals.
Read the information about data collection carefully. This feature uses data from users signed into their Google accounts to track them across devices and provide demographic information (age, gender, interests).
Click “Continue” if you want to enable it. Accept that you’ll update your privacy policy to reflect this data collection.
Only enable Google Signals if:
- Your privacy policy explicitly covers Google advertising features and cross-device tracking
- You have user consent where legally required (GDPR in Europe requires consent before tracking)
- You want cross-device reporting showing how users interact across mobile and desktop
- You need demographic reporting for audience insights
Skip this if:
- You’re unsure about legal requirements in your region
- You don’t have a lawyer-reviewed privacy policy
- You don’t need advanced demographic features
- Your site targets children (COPPA prohibits this tracking for children under 13)
When in doubt, skip Google Signals. Basic GA4 tracking provides sufficient insights for most small businesses without the added privacy compliance burden.
Enhanced Measurement Review
Enhanced Measurement automatically tracks common interactions without custom code. Verify these settings match your needs and disable any that create data pollution.
Go to Admin > Data Streams > Web and click your data stream. Look for “Enhanced measurement” and click the settings gear icon.
You’ll see toggles for:
- Page views: Leave ON (essential for all tracking)
- Scrolls: Leave ON (measures engagement depth)
- Outbound clicks: Leave ON (tracks exits to other sites)
- Site search: Leave ON if you have search functionality, OFF if you don’t
- Video engagement: Leave ON if you embed YouTube videos, OFF if you don’t
- File downloads: Leave ON to track PDF downloads and document access
- Form interactions: Consider turning OFF (often captures incomplete submissions and creates noise)
Form interactions tracking fires events when users interact with forms, not just when they submit. This creates events for people who clicked a form field but never submitted. These false signals make your data messy. Most professionals track form submissions using custom events triggered by thank-you pages instead.
Toggle off any features that don’t apply to your site. For example, if you never embed videos, disable video engagement tracking. If you don’t offer file downloads, disable that too.
Click “Save” after making changes.
Cross-Domain Tracking (If Your Site Spans Multiple Domains)
If your website spans multiple domains (example.com and shop.example.com, or example.com and checkout.example.net), set up cross-domain tracking so GA4 recognizes users moving between domains as one continuous session.
Without cross-domain tracking, users moving from your main site to your checkout subdomain appear as new visitors. Traffic from example.com to shop.example.com shows as referral traffic instead of direct navigation. User journeys break across domains, making conversion attribution impossible.
Go to Admin > Data Streams > Web and click your data stream. Scroll to “Configure tag settings” and click “Configure your domains.”
Add all domains your users navigate between as part of normal site flow. Don’t include “www” or “https://”—just the domain name (example.com, shop.example.com).
Click “Save.”
This tells GA4 to maintain session continuity when users move between these domains. The measurement protocol passes a client ID between domains so GA4 knows it’s the same user.
Most single-domain sites don’t need this. Only configure cross-domain tracking if your conversion flow requires users to move between different domains.
What Events to Track in GA4 (And Which to Ignore)
Google Analytics 4 tracks everything as events. Understanding which events matter for your business and which create noise is critical for useful analytics that actually inform decisions.
Automatic Event Collection
GA4 automatically collects these events without any setup:
- page_view: Fires when someone loads a page
- session_start: Fires when a session begins (first interaction or after 30 minutes of inactivity)
- first_visit: Fires when a user visits your site for the first time ever
- user_engagement: Fires when a page stays in focus for 10+ seconds
You can’t turn these off, and you don’t need to configure anything. These core events power most standard reports and provide baseline analytics.
Enhanced Measurement Events
With Enhanced Measurement enabled (it is by default), GA4 also tracks:
- scroll: User scrolls 90% down a page (measures content consumption)
- click: Clicks on links leaving your domain (tracks exits to other websites)
- view_search_results: Uses your site search (requires search parameter in URL like ?s= or ?q=)
- video_start, video_progress, video_complete: YouTube video engagement
- file_download: Downloads PDFs, documents, or files with common extensions
These provide good baseline data without custom code. Leave them enabled unless they create problems for your specific use case.
Events You Should Track Manually
Focus on events that indicate business value, user intent, or conversion progress. Track actions that help you make decisions, not every possible interaction.
For lead generation sites, track:
- Form submissions (contact forms, quote requests, newsletter signups)
- Phone number clicks (call tracking for mobile users)
- Email link clicks (mailto: link clicks)
- Live chat initiations (when users start chat conversations)
- Booking or calendar clicks (appointment scheduling links)
- Location finder usage (store locator interactions)
For e-commerce sites, track:
- Add to cart events (product interest signal)
- Begin checkout (serious purchase intent)
- Purchases (completed transactions – usually automatic with e-commerce setup)
- Product quick views or detail views
- Wishlist additions (save for later interest)
- Apply coupon code (deal-seeking behavior)
- Size or color selection (product customization)
For content sites, track:
- Article completion (scrolled to end of post)
- Social share clicks (content amplification)
- Comment submissions (engagement signal)
- Newsletter signups (audience building)
- Time spent on key articles (deep engagement)
- Related article clicks (content discovery)
For service businesses, track:
- Appointment booking starts (conversion funnel entry)
- Service selection or customization (intent specification)
- Pricing calculator usage (serious consideration)
- Location or availability checks (readiness to buy)
- Consultation requests (high-intent lead)
- Live demo or sample requests
For SaaS businesses, track:
- Free trial signups (conversion)
- Feature usage (product engagement)
- Upgrade clicks (monetization intent)
- Onboarding completion (activation)
- Help documentation views (friction points)
- Cancel flow entry (churn risk)
Events to Avoid Tracking
These events create data noise without providing useful insights:
Don’t track:
- Every button click (track only important CTAs like “Get Quote” or “Start Trial”)
- Every page scroll (Enhanced Measurement covers 90% scrolls, which is sufficient)
- Hover events (fire constantly as users move their mouse)
- Accordion or tab expansions (unless critical to understanding content consumption)
- Tooltip views or help icon clicks
- Every video interaction on pages with many videos (track completion, not every pause/play)
- Autoplaying carousel advances (users don’t control these)
- Cookie consent banner interactions (creates noise, not insight)
Why avoid these:
They inflate event counts artificially, make reports cluttered and hard to read, slow GA4 processing, hide meaningful events in noise, hit GA4’s 10 million event limit faster, and don’t help you make any business decisions.
Track actions users deliberately take that signal intent, not passive interface interactions or automatic behaviors.
Example: Setting Up a Newsletter Signup Event
Let’s track newsletter signups as a practical example. This process applies to most custom events.
Most newsletter forms redirect to a thank-you page after submission. Use this URL to trigger your event. This method is reliable because thank-you page views definitively prove form submission succeeded.
With Google Tag Manager:
In GTM, click “Tags” > “New.”
Click the tag configuration box and select “Google Analytics: GA4 Event” as the tag type.
In “Configuration Tag,” select your existing GA4 Configuration tag from the dropdown.
For “Event Name,” use lowercase with underscores: newsletter_signup
Follow GA4’s naming convention: lowercase letters, numbers, and underscores only. No spaces, no special characters. Maximum 40 characters.
Under “Triggering,” click to create a new trigger. Select “Page View” as trigger type.
Choose “Some Page Views” and configure the condition: “Page URL contains /thank-you/” (or whatever your thank-you page URL includes).
If your thank-you page URL is example.com/newsletter-thank-you/, use “contains /newsletter-thank-you/”. Be specific enough to avoid false triggers.
Save your trigger with a clear name like “Newsletter Thank You Page.”
Save your tag as “GA4 Event – Newsletter Signup.”
Click “Submit” in the top right to publish your changes. Name this version “Newsletter signup tracking added.”
Verify with DebugView:
Click “Preview” in GTM to enter preview mode. Fill out your newsletter form and submit it. When you reach the thank-you page, check DebugView in GA4.
You should see the “newsletter_signup” event appear. Click the event to verify parameters look correct. If data is wrong or the event doesn’t fire, adjust your GTM configuration.
Once verified, click “Submit” to publish your changes to your live site.
Without Google Tag Manager:
You’ll need developer help to add custom event tracking directly. Developers can use gtag.js commands to send events when forms submit successfully. This requires JavaScript knowledge and direct code editing.
This is precisely why Google Tag Manager is recommended—marketers can implement tracking without developer dependency.
How to Set Up Key Events (Conversions) in GA4
Key events (Google renamed “conversions” to “key events” in 2026) are user actions that matter most to your business. Marking events as key events makes them prominent in reports and enables them for Google Ads optimization.
Understanding Key Events
A key event signals that a user took valuable action. For e-commerce sites, this is usually a purchase. For lead generation, it’s form submissions or phone calls. For content sites, it might be newsletter signups or article completions. For SaaS, it’s trial signups or feature activations.
GA4 allows 30 key events per property. Choose carefully—mark only events that represent real business value, not vanity metrics.
Events like page views or scrolls shouldn’t be key events. They’re too common and don’t represent conversion. Key events should happen relatively rarely and indicate the user took action that could lead to revenue.
How to Mark an Event as a Key Event
Go to Admin > Events in the left sidebar. You’ll see a list of all events GA4 has recorded in the last 30 days.
Find the event you want to mark as a key event (newsletter_signup from our example above). Toggle the switch in the “Mark as key event” column.
That’s it. GA4 immediately starts treating this event as a conversion in reports. Historical data for this event now appears in conversion reports retroactively.
Important limitation: The event must exist in your account before you can mark it as a key event. If you just set up tracking for a new event, wait 24-48 hours for the event to appear in the Events list before you can mark it.
Alternative Method: Create Key Event Directly
Go to Admin > Key events in the left sidebar. Click “New key event.”
Enter the exact event name. This must match an existing event name precisely (including capitalization and underscores). Typos create a key event that never fires because no matching event exists.
For example, if your event is called “newsletter_signup” but you type “Newsletter_Signup” here, it won’t work. Event names are case-sensitive.
Click “Save.”
This method works when you know your event names but they haven’t appeared in the Events list yet. Use this for newly created events that haven’t collected data yet.
Which Events to Mark as Key Events
Essential key events for most businesses:
- Purchase (already marked by default in e-commerce setups)
- Lead form submissions (contact, quote, demo requests)
- Newsletter signups (audience building)
- Phone clicks (call tracking)
- Email clicks (direct contact intent)
- Chat initiations (support or sales conversations)
Consider marking these if they’re critical to your business model:
- Add to cart (helps measure shopping intent vs. completion)
- Begin checkout (measures abandoned cart rates)
- File downloads (for B2B companies offering resources, whitepapers)
- Video completions (for educational or service businesses where video viewing indicates serious interest)
- Account creations (for platforms where registration is the primary conversion)
- Specific high-value page views (pricing page, case studies page)
Don’t mark these as key events:
- Page views (too common, happens on every visit)
- Scrolls (automatic behavior, not deliberate action)
- Outbound clicks (unless to critical partner sites where exit = success)
- Session starts (automatic, not a conversion)
- Generic “click” events without specific context
Key events should answer: “Did the user do something that could lead to revenue or indicate strong interest in buying?” If yes, mark it. If not, leave it as a regular event.
Conversion Counting Methods
By default, GA4 counts every instance of a key event. If a user submits three forms in one session, GA4 records three conversions. This inflates numbers for some use cases but makes sense for others.
To change counting method, go to Admin > Key events. Click your key event name.
Select “Change counting method.” Choose between:
- Once per event (default): Counts every occurrence. Use for purchases where quantity matters.
- Once per session: Counts maximum one conversion per session, even if the event fires multiple times. Use for form submissions where multiple submissions in one session shouldn’t count separately.
For newsletter signups, use “once per session” because someone filling out your form twice in 10 minutes represents one conversion, not two.
For e-commerce purchases, use “once per event” because two separate purchases in one session should count as two conversions.
Understanding GA4 Reports for Beginners
GA4 organizes reports into collections that answer different business questions. Understanding the report structure helps you find insights faster and avoid getting lost in the interface.
The Reports Snapshot
Go to Reports > Overview (called “Reports snapshot” in the interface). This dashboard shows your most important metrics at a glance.
You’ll see:
- Users: Unique visitors in the selected date range
- Key events: Total conversions across all marked events
- Total revenue: Sum of purchase events (if e-commerce tracking is set up)
- Active users in last 30 minutes: Real-time visitor count
Cards below show user acquisition (where visitors come from), engagement metrics (how they interact), and popular content (what they view). This overview gives you daily performance without diving deep into specific reports.
Use this page for your daily check-in. Spend 2 minutes here every morning to verify tracking still works and spot any major changes.
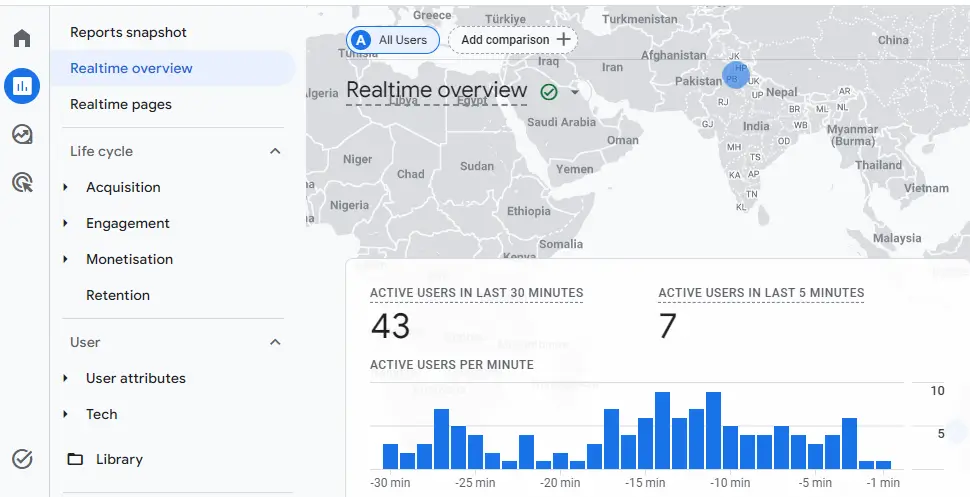
Realtime Report
Reports > Realtime shows activity from the last 30 minutes. This report updates every few seconds with current visitor activity.
Use Realtime to:
- Verify tracking works after making changes (you should see yourself browsing)
- Monitor traffic during campaign launches (watch visitors arrive from your email send)
- Check if promoted content drives immediate visits (share a post and see traffic spike)
- Validate that high-traffic events show up correctly (Black Friday sales, product launches)
Don’t use Realtime for business decisions. The sample size is too small (30 minutes of data) and the data is unprocessed. Use it for verification and monitoring, not analysis.
Acquisition Reports
These reports answer: “Where do my visitors come from?”
Traffic Acquisition (Most Useful for Marketers)
Reports > Acquisition > Traffic acquisition shows your traffic sources with session-level data.
By default, the table groups by “Session default channel group” which shows categories like Organic Search, Direct, Paid Search, Social, Email, Referral, and others. Google automatically categorizes traffic based on how users arrived.
Click the dropdown above the table to change to “Session source/medium” for more granular detail. This shows specific sources like “google/organic” (Google search), “facebook.com/referral” (Facebook links), or “newsletter/email” (email campaigns).
Key columns to monitor:
- Users: Unique visitors from this source
- Sessions: Total visits (users can have multiple sessions)
- Engagement rate: Percentage of sessions where users actively engaged (stayed 10+ seconds, viewed 2+ pages, or triggered a key event)
- Average engagement time per session: How long engaged sessions lasted
- Key events: Conversions from this source
- Total revenue: Revenue generated by this traffic
Sort by “Users” to see your biggest traffic sources. Sort by “Engagement rate” to find your highest-quality traffic. Sort by “Key events” to identify conversion drivers.
Compare channels to identify which marketing efforts work. If paid search drives traffic but has low engagement rate, your landing pages might not match ad promises. If organic search shows high engagement but low conversions, your content attracts interest but doesn’t push users toward action.
This report answers questions like: Which channel should I invest more budget in? Which traffic source drives the most qualified leads? Is my SEO or paid advertising working better?
Engagement Reports
These reports answer: “What do visitors do on my site?”
Pages and Screens
Reports > Engagement > Pages and screens shows which content performs best.
Key columns:
- Views: Total page views (includes repeat views by same user)
- Users: Unique visitors to this page
- Average engagement time: How long users stayed on this page
- Event count: Total events triggered on this page
Sort by “Views” to find your most popular content. Sort by “Average engagement time” to identify content that holds attention. Compare these two metrics to find pages with high views but low engagement—these pages might need improvement.
For example, if your homepage gets 10,000 views but only 15 seconds average engagement, people are landing and leaving immediately. That’s a problem requiring investigation.
Events
Reports > Engagement > Events shows all events firing on your site with frequency counts.
This report helps you verify custom tracking works, identify which interactions happen most frequently, and spot tracking issues (like events firing thousands of times when they should fire once).
Click any event name to see additional detail about that event’s performance over time, which pages trigger it most, and which user segments interact with it.
Conversions
Reports > Engagement > Conversions shows your key events together in one report for easy comparison.
Track conversion trends over time, compare which key events fire most frequently, and identify your primary conversion drivers. This report becomes more useful as you accumulate weeks and months of data.
Monetization Reports (E-commerce)
These reports answer: “What products sell and how do users purchase?”
E-commerce Purchases
Reports > Monetization > E-commerce purchases shows product performance if you’ve implemented e-commerce tracking.
You’ll see items viewed, items added to cart, items purchased, and revenue per item. This helps identify best-sellers, products that attract interest but don’t convert, and items that need better visibility.
For example, if a product has 1,000 views and 500 add-to-carts but only 10 purchases, something breaks in your checkout flow for that specific product.
User Purchase Journey
Reports > Monetization > User purchase journey visualizes your conversion funnel as a Sankey diagram.
The funnel typically shows:
- Session start (everyone who visits)
- View item (looked at products)
- Add to cart (shopping intent)
- Begin checkout (serious purchase intent)
- Purchase (conversion)
Each step shows how many users progressed and how many abandoned. High abandonment at “begin checkout” suggests checkout friction (too many form fields, unexpected shipping costs, unclear process). Drop-off after “view item” might indicate pricing concerns or unclear value propositions.
Using Date Ranges and Comparisons
Every report defaults to the last 28 days. Click the date selector in the top right to change this.
Useful date ranges for different purposes:
- Last 7 days: Quick spot checks, verify recent changes worked
- Last 28 days: Monthly trends, standard reporting period
- Last 90 days: Quarterly patterns, seasonal insights
- Custom: Specific campaign periods (email send date to two weeks after), year-over-year comparisons (this December vs last December)
Toggle “Compare” to analyze changes between periods. Select “Preceding period” to compare this month to last month. Select “Previous year” to identify seasonal trends and year-over-year growth.
The comparison shows percentage changes and absolute differences. Green indicates improvement, red shows decline. Use these comparisons to validate that changes you made (new content, website updates, marketing campaigns) actually improved metrics.
Filtering and Searching Reports
Most reports include a search bar above the data table. Use this to find specific pages, traffic sources, or events quickly instead of scrolling through hundreds of rows.
Click “Add comparison” at the top of most reports to segment your data. For example, compare mobile vs desktop users, new vs returning visitors, or traffic from specific countries.
Comparisons help identify which user segments perform differently. You might discover mobile users have 60% lower conversion rates than desktop users, revealing a mobile UX problem to fix.
Common GA4 Setup Mistakes (And How to Fix Them)
These errors appear in most beginner implementations. Catching them early prevents months of bad data and lost insights.
Mistake 1: Not Changing Data Retention From the Default 2 Months
The error: Leaving data retention at the default 2 months instead of changing it to 14 months immediately.
Why it matters: After 60 days, GA4 permanently deletes detailed user data. You lose the ability to create custom reports analyzing behavior older than 2 months, build audiences for remarketing based on actions from 90+ days ago, or use Exploration reports with historical data.
The impact: Six months after setup, you want to analyze how users who first visited in January behave differently from those who found you in June. GA4 deleted January data already. You can’t run the analysis.
How to fix it: Go to Admin > Data Settings > Data Retention. Change to 14 months immediately. This setting cannot be applied retroactively—data already deleted stays deleted forever.
Prevention: Change this setting within 24 hours of creating your GA4 property, before any significant data collection happens.
Mistake 2: Tracking Your Own Visits Without Filtering
The error: Not filtering internal traffic from employees, contractors, yourself, and anyone who works on the website regularly.
Why it matters: Your visits inflate metrics and skew behavior data. A small team checking the site daily can represent 20-30% of reported traffic for small businesses. Your behavior (checking every page, testing forms, reviewing content) doesn’t match real visitor patterns.
The impact: Metrics look better than reality. You think users spend 5 minutes on your pricing page when actually it’s you spending 20 minutes reviewing copy. You make decisions based on contaminated data.
How to fix it: Go to Admin > Data Settings > Data Filters and create an internal traffic filter. Add your office IP address and any remote worker IPs under Admin > Data Streams > Configure tag settings > Define internal traffic.
Prevention: Set up internal traffic filtering within the first week of GA4 installation, as soon as you verify tracking works.
Mistake 3: Installing GA4 Tracking Code Twice (Duplicate Implementation)
The error: Adding GA4 code both directly to your site and through Google Tag Manager, or installing multiple GA4 plugins that all add the same tracking.
Why it matters: Every page view registers twice, every event double-counts, and all metrics show 2x actual traffic. Your 1,000 monthly visitors look like 2,000. Your conversion rate appears half of what it actually is.
The impact: You can’t trust any metric in your account. All decisions based on this data lead you in wrong directions.
How to check: View your website’s page source (right-click > View Page Source). Search for your Measurement ID (G-XXXXXXXXXX). If it appears more than once, you have duplicate tracking.
How to fix it: Choose one installation method (GTM is recommended) and remove all other implementations. If using GTM, delete any GA4 code pasted directly in your site’s HTML. If using direct code, disable all GA4 plugins and remove the GTM container.
Prevention: Document your installation method. When someone asks “Is GA4 installed?”, you can say “Yes, via GTM” or “Yes, via Site Kit plugin” and prevent duplicate installations.
Mistake 4: Wrong Timezone or Currency Settings
The error: Property timezone doesn’t match your business operations timezone, or currency is set to the wrong type.
Why it matters: Reports show activity on wrong dates (midnight happens at the wrong time), year-over-year comparisons break, seasonal analysis becomes impossible, and revenue shows in wrong currency (1000 USD showing as 1000 EUR).
The impact: You compare “last Tuesday” to the previous Tuesday, but they’re actually different days because your timezone is wrong. Your seasonal trends appear shifted by hours or days.
How to check: Go to Admin > Property Settings. Check “Reporting time zone” and “Currency.”
How to fix it: You can change currency anytime without affecting historical data. Currency is just a display setting. But you cannot change timezone after property creation—this requires creating a new property and starting over with fresh tracking.
Prevention: Consider timezone choice carefully during initial setup. If your business operates in New York but most customers are in London, decide which timezone makes more sense for your reporting needs.
Mistake 5: Not Verifying Installation Works
The error: Installing tracking code but never checking if it actually works and collects data correctly.
Why it matters: Broken tracking means zero data collection. You won’t notice until weeks later when you check reports and realize nothing ever tracked. You lost all that historical data permanently.
The impact: You make business decisions without data for weeks or months. Competitors who installed tracking correctly have insights you lack.
How to prevent it: Always verify using Realtime or DebugView immediately after installation. Check again 24 hours later to confirm data flows correctly into standard reports. Schedule a weekly verification check for the first month.
Mistake 6: Tracking Too Many Pointless Events
The error: Setting up events for every button click, hover, scroll, accordion expansion, and minor interaction users make.
Why it matters: Reports become cluttered with meaningless data, useful events get buried in noise, GA4’s 10 million event/month limit gets exhausted on junk data, processing slows down, and finding insights becomes harder.
The impact: You track 50 events but only 5 matter for business decisions. You spend time maintaining tracking that provides zero value.
How to fix it: Go to Admin > Events. Review your event list. Disable or delete events that don’t help business decisions. Ask for each event: “What decision would this data inform?” If you can’t answer, delete it.
Prevention: Start with 5-10 essential events. Add more only when you have specific business questions requiring that data.
Mistake 7: Not Marking Important Events as Key Events
The error: Tracking conversions with custom events but forgetting to mark them as key events in GA4.
Why it matters: Conversions don’t appear in conversion reports, you can’t optimize Google Ads for these conversions, funnels don’t work correctly, and it’s harder to track progress toward business goals.
The impact: You track form submissions but can’t see conversion rate by traffic source because form submissions aren’t marked as key events.
How to fix it: Go to Admin > Events. Toggle on “Mark as key event” for your most important events (purchases, leads, signups).
Prevention: Immediately after setting up a conversion tracking event, mark it as a key event. Don’t wait.
Mistake 8: Ignoring Enhanced Measurement Settings
The error: Leaving all Enhanced Measurement options enabled without reviewing whether they make sense for your specific site.
Why it matters: Some Enhanced Measurement events create noise without value. Form interactions tracking, for example, often captures partial submissions or accidental clicks that don’t represent real intent.
The impact: Your Events report shows thousands of “form_start” events that don’t correlate with actual form submissions. This data noise makes real patterns harder to spot.
How to fix it: Go to Admin > Data Streams > Web > Enhanced measurement settings. Review each option and toggle off features that don’t apply to your site or create data pollution.
Prevention: Review Enhanced Measurement settings during initial configuration, not months later after collecting bad data.
Mistake 9: No Cross-Domain Tracking When You Need It
The error: Not setting up cross-domain tracking for sites that span multiple domains (main site on example.com, checkout on shop.example.com).
Why it matters: Users moving from yoursite.com to shop.yoursite.com appear as new visitors. Traffic from your main site looks like referral traffic instead of internal navigation. User journeys break across domains, making attribution impossible.
The impact: Your conversion reports show that shop.example.com is your #1 traffic source, when actually it’s users navigating from example.com. You can’t track the complete customer journey from first visit to purchase.
How to check: Do users move between different domains as part of normal site flow? Do you send traffic from one domain to another domain you own?
How to fix it: Go to Admin > Data Streams > Configure your domains. Add all domains users navigate between as part of one experience.
Prevention: During initial setup, map out your entire user journey. If it crosses domains, set up cross-domain tracking immediately.
Mistake 10: Never Checking Reports After Setup
The error: Installing GA4 successfully but never logging in to review data or verify tracking still works.
Why it matters: You don’t notice when tracking breaks, miss opportunities to optimize based on data, waste the entire point of having analytics, and competitors who check data weekly make better decisions.
The impact: Three months after setup, you finally check reports and discover tracking broke six weeks ago. You lost six weeks of data permanently.
How to prevent it: Schedule a weekly 15-minute review every Monday morning. Check Realtime report to verify tracking still works, review Traffic Acquisition to identify your best sources, and monitor key event trends to track conversions.
Make it a habit: Block calendar time. Don’t rely on remembering to check. Treat analytics review like any other business priority.
What to Do in Your First Week After Installing GA4
Day-by-day actions to ensure your GA4 setup succeeds and you build good analytics habits from the start.
Day 1: Installation and Verification
- Install GA4 using your chosen method (GTM recommended)
- Verify in Realtime report (see yourself browsing)
- Test with DebugView (confirm events fire correctly)
- Change data retention to 14 months immediately
- Set up internal traffic filter (add your IP address)
- Document what you installed and where for future reference
Day 2: Essential Event Setup
- Identify 3-5 most important user actions for your business
- Set up event tracking for these actions (form submissions, purchases, signups)
- Test each event fires correctly using DebugView
- Mark critical events as key events
- Verify key events appear in conversion reports within 24-48 hours
Day 3: Configuration Review
- Review Enhanced Measurement settings (disable unnecessary options)
- Double-check timezone and currency settings
- Set up cross-domain tracking if needed (multiple domains)
- Connect Google Ads if you run paid campaigns
- Review all data sharing settings for privacy compliance
Day 4: Report Familiarization
- Browse all report sections (Reports snapshot, Acquisition, Engagement, Monetization)
- Understand what each report shows and when to use it
- Practice using date range comparisons
- Learn filtering and searching within reports
- Bookmark your most useful reports for quick access
Day 5: Team Training
- Share access with team members who need analytics
- Assign appropriate permissions (Viewer for most people, Editor for marketers)
- Show them the three most important reports for their roles
- Explain what metrics they should monitor
- Set expectations about data availability (24-48 hour processing delay)
Day 6: Goal Setting and Benchmarking
- Define what success looks like for your business
- Identify benchmarks to track monthly (traffic, conversions, revenue)
- Determine report review frequency (daily Realtime check, weekly deep dive)
- Create accountability for checking data (assign ownership)
- Plan first round of optimizations based on early data patterns
Day 7: Documentation and Planning
- Document your complete implementation (what’s tracked, how, where)
- List all events being tracked with definitions
- Note any custom configurations you made
- Create a troubleshooting checklist for common issues
- Schedule your first monthly review meeting
- Set up automated reports if needed (export to Google Sheets, email summaries)
After week one, shift to a sustainable rhythm. Check Realtime once per week to verify tracking still works (Monday morning routine). Review Traffic Acquisition weekly to spot trends early. Monitor key events weekly to track progress toward goals. Make data reviews a consistent habit before diving into complex optimization.
Frequently Asked Questions About GA4 for Beginners
Do I still need Google Analytics 4 if I had Universal Analytics?
Yes. Universal Analytics stopped working on July 1, 2024, and all historical data was permanently deleted on July 1, 2025. GA4 is now the only version of Google Analytics available. Every website needs to set up GA4 to track visitors and measure performance. There is no other Google Analytics option.
Is Google Analytics 4 free?
Yes. Google Analytics 4 is free for most websites with up to 10 million events per month. This limit is sufficient for small to medium businesses. Only large enterprises processing more than 10 million events monthly need GA4 360, which is a paid version offering higher limits, advanced features, and dedicated support.
How long does it take to set up Google Analytics 4?
Basic GA4 setup takes 15-30 minutes. You need to create a property, install the tracking code, and verify data collection works. Full configuration including event tracking, conversion setup, and report customization can take 2-3 hours depending on your business complexity and tracking needs.
Can I use Google Analytics 4 without Google Tag Manager?
Yes. You can install GA4 by pasting the tracking code directly into your website’s HTML or using a plugin. However, Google Tag Manager is recommended because it makes managing tracking significantly easier and lets you add new tracking without editing your site’s code every time you need changes.
What’s the difference between Google Analytics 4 and Universal Analytics?
GA4 uses event-based tracking instead of session-based tracking, works across websites and apps in one property, includes predictive analytics with machine learning, and focuses on privacy-first measurement. Universal Analytics stopped collecting data in July 2024 and is no longer available. They are completely separate platforms that don’t share data.
How do I know if Google Analytics 4 is working correctly?
Check the Realtime report in GA4 while browsing your website. You should see yourself appear as an active user within 30 seconds. Alternatively, use DebugView for detailed event verification by enabling debug mode in Google Tag Manager Preview or using the Google Analytics Debugger Chrome extension.
Q: What should I track in Google Analytics 4 as a beginner?
Track user actions that indicate business value: form submissions, purchases, email signups, phone clicks, file downloads, and button clicks on key calls-to-action. Start with 3-5 essential events and add more as needed. Avoid tracking every interaction—focus on actions that help you make business decisions.
Can I see historical data from Universal Analytics in Google Analytics 4?
No. GA4 and Universal Analytics are separate platforms with no data sharing. If you exported your Universal Analytics data before the July 1, 2024 shutdown, you can use it for comparison purposes, but GA4 only shows data collected after you installed GA4 tracking on your website.
Do I need coding skills to set up Google Analytics 4?
No. Most website platforms (WordPress, Shopify, Wix, Squarespace) offer plugins or built-in settings for GA4 installation. You simply paste your measurement ID and the plugin handles the technical implementation. Google Tag Manager also requires no coding for basic setup and event tracking.
How much does Google Analytics 4 cost for small businesses?
Google Analytics 4 is completely free for businesses processing up to 10 million events per month. Most small to medium businesses never hit this limit. Only large enterprises need GA4 360, which requires custom pricing from Google and typically costs $50,000-$150,000 annually.
Will GA4 slow down my website?
No. GA4’s tracking code is lightweight (approximately 17KB) and loads asynchronously, meaning it doesn’t block your page from loading. The impact on page speed is typically under 0.1 seconds. Google Tag Manager actually improves performance by managing all tracking tags efficiently through one container.
Can I undo GA4 installation if something goes wrong?
Yes. Simply remove the tracking code or disable the GA4 tag in Google Tag Manager. Your website will return to its previous state immediately. Any data already collected in GA4 remains accessible in your account. Removing tracking code cannot break your website or delete your content.
Do I need to tell website visitors I’m using Google Analytics?
In most regions, yes. GDPR in Europe and similar privacy laws in other regions require notice in your privacy policy and often explicit consent before tracking begins. Check your local regulations or consult a legal professional for compliance requirements specific to your location and industry.
What happens if I set up GA4 incorrectly?
You’ll collect incorrect or incomplete data, but you won’t break your website. Common issues include tracking the same event twice (duplicate installation), missing conversions (events not marked as key events), or filtering out real users accidentally. Most problems are fixable without losing historical data.
Can I use GA4 and another analytics tool at the same time?
Yes. Many websites use GA4 alongside tools like Matomo, Plausible, Adobe Analytics, Mixpanel, or Heap. Each tool tracks independently without interfering. Using multiple tools provides data validation, covers different use cases, and protects against data loss if one tool fails.
Should I track everything users do on my website?
No. Track actions that help you make business decisions. Tracking too many events makes reports cluttered, can hit GA4’s event limits faster, and makes finding useful insights harder. Start with 5-10 essential events representing user intent and business value.