Your site might look great, load fast on your own laptop, and convert well enough to keep the team happy. But Google doesn’t measure your site the way you do. It measures how real users experience it: on slow phones, on patchy mobile connections, in the middle of the afternoon when server load is high.
That’s exactly what Core Web Vitals measure. And since 2021, they’ve been a confirmed part of Google’s ranking system.
This guide covers what each Core Web Vital measures, the score thresholds that separate “good” from “poor,” the right tools to check your own data, and practical steps to improve each metric. No filler. Just what you need to know.
Table of Contents
What Are Core Web Vitals?
Core Web Vitals are three performance metrics Google uses to measure real-world user experience on web pages. They cover load speed (Largest Contentful Paint), interactivity (Interaction to Next Paint), and visual stability (Cumulative Layout Shift). Google uses Core Web Vitals as part of its page experience ranking signals.
Google introduced the Web Vitals initiative to give site owners a focused set of performance benchmarks. Not a long list of abstract technical scores, but three specific numbers that reflect how a real person experiences a page. Poor scores don’t just hurt rankings. They hurt bounce rates, conversion rates, and revenue. Research by Google shows that pages meeting the Core Web Vitals thresholds see meaningfully better engagement metrics than those that don’t.
The data behind Core Web Vitals comes from real Chrome users, not just lab simulations. That distinction matters, as you’ll see below.
The Three Core Web Vitals Metrics
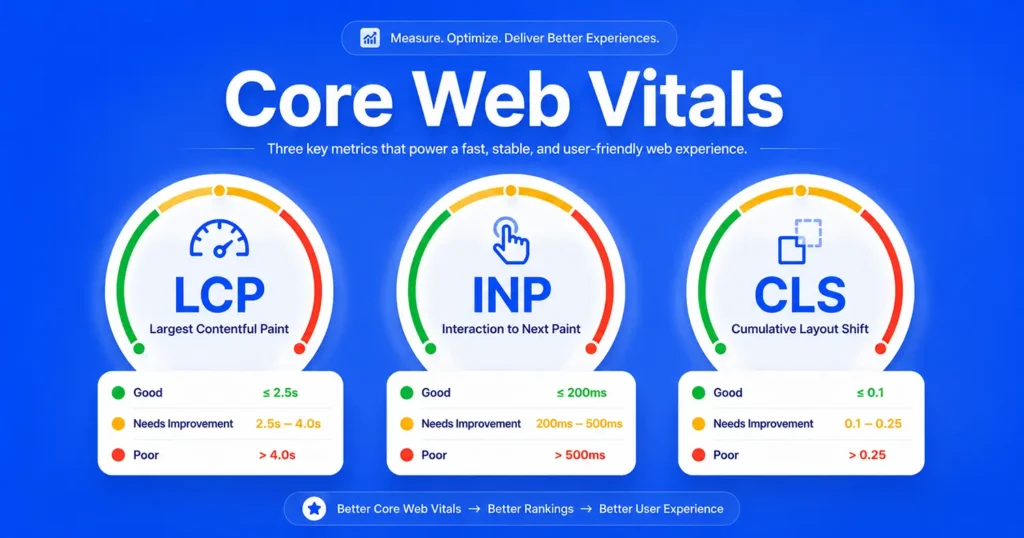
Each metric targets a different dimension of user experience. Here’s what they measure and what Google considers a passing score.
| Metric | What It Measures | Good | Needs Work | Poor |
|---|---|---|---|---|
| LCP | Load speed | ≤ 2.5s | 2.5s–4s | > 4s |
| INP | Interactivity | ≤ 200ms | 200ms–500ms | > 500ms |
| CLS | Visual stability | ≤ 0.1 | 0.1–0.25 | > 0.25 |
Google assesses performance at the 75th percentile of page loads. That means your page needs to pass for at least 75% of real user sessions, not just your best-case scenario.
Largest Contentful Paint (LCP)
What it is: Largest Contentful Paint (LCP) measures how long it takes for the largest visible element on the page to finish loading. That element is usually a hero image, a featured photo, or a large block of text. LCP represents the moment the page feels loaded to a user.
The threshold: LCP should happen within 2.5 seconds of the page starting to load. Anything between 2.5 and 4 seconds needs improvement. Above 4 seconds is poor.
Why it matters for users: A slow LCP feels like the page is broken or stuck. Users don’t wait. Google’s own data consistently shows that slower load speeds increase bounce rates, often dramatically. For an e-commerce product page, a slow LCP is a conversion killer before the user even sees the price.
Common LCP elements include:
- Hero images (
<img>tags) - Large images inside
<video>elements - Background images loaded via CSS
url() - Large blocks of text in block-level elements
LCP is heavily influenced by server response time, render-blocking JavaScript and CSS, and whether images are properly optimized and preloaded.
Interaction to Next Paint (INP)
What it is: Interaction to Next Paint (INP) measures how quickly a page responds to user interactions throughout the entire session, not just the first one. It captures clicks, taps, and keyboard inputs, then records the time from that interaction to when the next visual update appears on screen. The score reported is the worst interaction delay observed during the session.
The threshold: A good INP score is 200 milliseconds or less. Between 200ms and 500ms needs improvement. Above 500ms is poor.
Why INP replaced FID: First Input Delay (FID) only measured the delay before the browser started processing a user’s first interaction. That was useful but incomplete. INP measures the full responsiveness of the page across every interaction, making it a far more accurate picture of how interactive a page actually feels to real users. Google made INP a stable Core Web Vital in March 2024 and retired FID at the same time.
Why it matters for users: A page with a high INP feels sluggish and unresponsive. Buttons seem to lag. Dropdown menus hang. For sites with complex filtering, forms, or interactive content (think e-commerce product configurators, mortgage calculators, or booking flows), a poor INP score directly damages the user experience and conversion rates.
Cumulative Layout Shift (CLS)
What it is: Cumulative Layout Shift (CLS) measures the visual stability of a page as it loads. It records unexpected movement of elements (images, buttons, text blocks, banners) and scores the total amount of layout shifting that occurs.
The threshold: A CLS score of 0.1 or lower is good. Between 0.1 and 0.25 needs improvement. Anything above 0.25 is poor.
Why it matters for users: Layout shifts are genuinely frustrating. A user goes to tap a button and the page shifts at the last second, so they tap an ad instead. Or a form suddenly jumps down the page as an image loads above it. CLS measures exactly this problem. Google restricts the measurement window to a five-second period where the most shifting occurs, which makes the score fairer for long-scroll pages.
Common causes of high CLS:
- Images without defined width and height attributes
- Ads, embeds, or iframes with no reserved space
- Dynamically injected content (pop-ups, banners, cookie notices) that push content down
- Web fonts that swap in and cause text to reflow
What Happened to First Input Delay (FID)?
FID measured the time between a user’s first interaction with a page and when the browser actually started processing that interaction. It was useful, but it only captured a single moment (the very first click or tap) and ignored everything that happened after.
Google retired FID as a Core Web Vital in March 2024 and replaced it with Interaction to Next Paint (INP). INP measures responsiveness across the entire page session, making it a significantly better indicator of how interactive a page feels in the real world.
Old reports or audits that still show FID data predate the switch. INP is now the metric that counts.
How to Measure Core Web Vitals
There are two types of Core Web Vitals data: field data and lab data.
Field data comes from real users visiting your site through Chrome. It reflects actual network conditions, real devices, and genuine user behavior. This is the data Google uses for ranking.
Lab data comes from controlled test environments. Tools simulate a page load under specific conditions and give you a score. Lab data is useful for diagnosing issues and testing changes before they go live, but it won’t always match your field data.
The tools below give you both.
Google PageSpeed Insights
Google PageSpeed Insights is the free tool most site owners start with, and it’s one of the best. It shows both your field data (from the Chrome User Experience Report) and lab data (from Lighthouse). You get scores for each Core Web Vital, along with specific diagnostics and improvement suggestions.
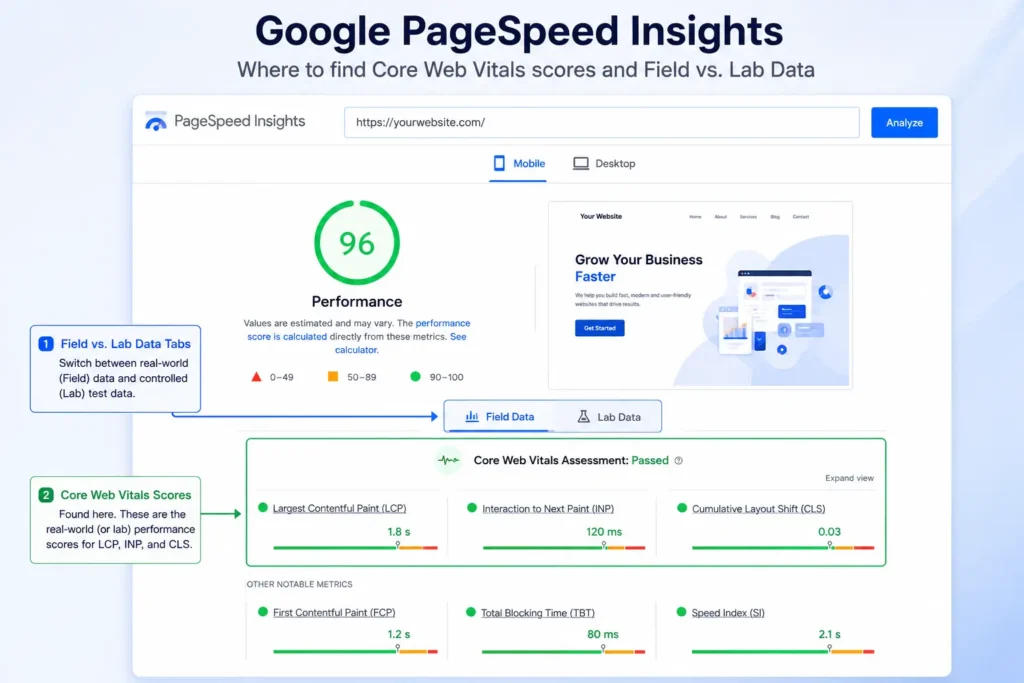
Enter any URL and you’ll see an immediate breakdown of your LCP, INP, and CLS, along with which elements are causing problems and why.
Google Search Console
Google Search Console includes a dedicated Core Web Vitals report under the “Experience” section. It aggregates field data across your entire site, grouped by “Good,” “Needs improvement,” and “Poor.” You can drill into specific URL groups to see where problems are concentrated.
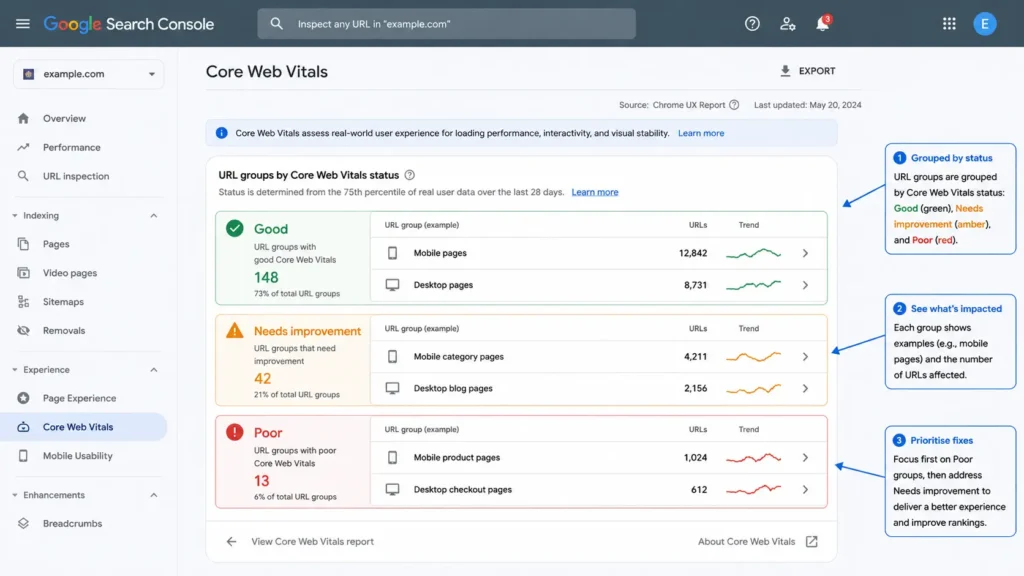
Search Console uses data from the Chrome User Experience Report (CrUX), which collects anonymized performance data from real Chrome users. Sites without enough traffic may have limited or unavailable CrUX data. In that case, PageSpeed Insights lab data is your best starting point.
Chrome DevTools
Chrome DevTools gives you granular lab data directly in your browser. Open DevTools (F12), navigate to the Performance panel, enable Screenshots, and reload the page. The timing graph will show you the LCP moment, layout shift events, and long tasks that could be causing INP issues.
DevTools is particularly useful for identifying which specific elements are causing problems: the LCP element, the shift-causing asset, or the long JavaScript task blocking interactivity.
Chrome User Experience Report (CrUX)
The Chrome User Experience Report is the source of Google’s field data. It contains real-world performance metrics from Chrome users who opted into sharing their data. CrUX data powers both Search Console and PageSpeed Insights field data tabs. You can also query CrUX directly through the CrUX API or BigQuery if you want to analyze trends at scale.
How to Improve Your Core Web Vitals Scores
Knowing your scores is step one. Improving them is where most sites stall. Here’s what actually moves the needle for each metric.
How to Improve LCP
LCP is primarily a loading performance problem. The fastest wins usually come from:
1. Optimize and preload your LCP image. The LCP element is usually an image. Make sure it’s properly compressed (WebP format where possible), sized correctly for the viewport, and preloaded with <link rel="preload"> in the <head>. Don’t lazy-load the LCP image. That actively delays it.
2. Reduce server response time (TTFB). Time to First Byte (TTFB) directly affects LCP. If the server takes too long to respond, everything downstream is delayed. Use a fast hosting provider, implement server-side caching, and consider a Content Delivery Network (CDN) to serve assets from locations closer to your users.
3. Remove render-blocking resources. JavaScript and CSS that load in the <head> before the page renders can block LCP significantly. Defer non-critical JavaScript. Inline critical CSS. Load everything else after the LCP element is painted.
4. Compress and cache assets. Enable Gzip or Brotli compression on your server. Set long cache expiration headers for static assets. These changes reduce the raw size and repeat-load time of everything on the page.
How to Improve INP
INP is an interactivity problem, usually caused by JavaScript that runs too long and blocks the main thread. Fixes are often more technical than LCP or CLS, but the impact is significant.
1. Break up long JavaScript tasks. INP suffers when JavaScript tasks run longer than 50ms and block the browser from responding to user input. Use browser DevTools to identify long tasks. Break them into smaller chunks using setTimeout or the Scheduler API so the browser stays responsive between tasks.
2. Minimize third-party scripts. Analytics tools, chat widgets, ad scripts, and tracking pixels all run JavaScript that competes for main thread time. Audit your third-party scripts and remove anything that isn’t actively contributing value. Load the rest asynchronously or defer their initialization.
3. Optimize event handlers. Slow click or tap handlers delay the browser’s response to user input. Keep event handler functions as lean as possible. Move expensive operations (like DOM updates or API calls) out of the critical response path.
4. Use Total Blocking Time (TBT) as a proxy. TBT is a lab metric that correlates strongly with INP. It measures how much time the main thread is blocked by long tasks during page load. A high TBT in PageSpeed Insights usually points to the same JavaScript issues hurting your INP in the field.
How to Improve CLS
CLS is a layout stability problem. The most common causes are also the easiest to fix.
1. Set explicit dimensions on images and videos. Images and videos without defined width and height attributes cause the browser to reserve no space for them. When they load, they push other content down. That’s a layout shift. Always include dimensions in your HTML or reserve space with CSS aspect-ratio.
2. Reserve space for ads, embeds, and dynamic content. Ad slots, cookie banners, and dynamically injected content are among the biggest CLS offenders. Reserve the expected space in your layout before the content loads using a placeholder or minimum height. This prevents the page from jumping when the content appears.
3. Avoid inserting content above existing content. Content dynamically added above the fold (banners, alerts, notifications) pushes everything down and directly increases CLS. Load this content below existing page elements or use fixed/sticky positioning so it doesn’t affect document flow.
4. Use font-display: optional or preload web fonts. Web fonts that swap in after the page loads cause text to reflow, which counts as a layout shift. Either preload your fonts so they’re ready before the page renders, or use font-display: optional to prevent the font swap entirely.
Which Core Web Vital Should You Fix First?
Most sites don’t have unlimited developer time, so prioritization matters.
Start with LCP if your score is above 4 seconds. A poor LCP score is the most directly damaging to perceived performance, and image and server optimizations tend to have the clearest ROI with the least technical complexity.
Fix CLS next if you have visible layout shifts. This is often the fastest problem to solve. Adding width and height attributes to images and reserving ad space can dramatically improve CLS with a few lines of CSS.
Tackle INP last if it’s the only remaining problem. INP fixes require JavaScript profiling and are generally more complex. But if your LCP and CLS are already good and INP is still failing, it’s worth the investment, especially if your site relies heavily on user interaction.
If all three are failing simultaneously, work in this order: LCP → CLS → INP.
Do Core Web Vitals Actually Affect Your Google Rankings?
Yes. With some context.
Google confirmed Core Web Vitals as a ranking signal in May 2021 (mobile) and February 2022 (desktop). They’re part of the broader page experience signals that Google uses alongside other factors like HTTPS, mobile-friendliness, and intrusive interstitial guidelines.
Core Web Vitals are a tiebreaker, not a primary ranking driver. A page with excellent content and poor Core Web Vitals scores will generally still rank above a page with great scores but thin content. But at competitive keyword levels, where content quality is roughly equal across the top 10, Core Web Vitals become a meaningful differentiator.
The more direct impact is on user behavior. Pages that load fast, respond quickly, and don’t shift around retain users better. Lower bounce rates, longer sessions, and higher conversion rates all send positive signals to Google over time. Core Web Vitals optimization is as much a conversion rate play as it is an SEO one.
A broader technical SEO audit should include Core Web Vitals on the checklist alongside crawlability, indexation, and site architecture.
Frequently Asked Questions
What are the three Core Web Vitals?
The three Core Web Vitals are Largest Contentful Paint (LCP), which measures load speed; Interaction to Next Paint (INP), which measures how quickly a page responds to user interactions; and Cumulative Layout Shift (CLS), which measures how much page elements shift unexpectedly while loading.
What is a good Core Web Vitals score?
Google defines “good” as: LCP under 2.5 seconds, INP under 200 milliseconds, and CLS under 0.1. Your page needs to hit all three thresholds at the 75th percentile of real user sessions to be considered passing.
What tool should I use to check my Core Web Vitals?
Google PageSpeed Insights is the best starting point. It’s free, shows both real-user field data and lab data, and gives you specific improvement suggestions. Google Search Console’s Core Web Vitals report shows aggregated field data across your full site.
Do Core Web Vitals affect SEO rankings?
Yes. Google confirmed Core Web Vitals as part of its page experience ranking signals in 2021. They’re not the most powerful ranking factor, but they do influence rankings and they directly affect user behavior metrics like bounce rate and time on site.
What replaced First Input Delay (FID)?
Interaction to Next Paint (INP) replaced FID in March 2024. INP is a more comprehensive measure of interactivity. It tracks the response time across all user interactions during a page session, not just the first one.
How often does Google update Core Web Vitals?
Google reviews the Core Web Vitals annually. Stable metrics like LCP, INP, and CLS change infrequently, but their thresholds or measurement methods can be updated. New experimental metrics can enter the pipeline at any time. Google’s web.dev documentation is the most reliable place to track changes.
What is the Chrome User Experience Report?
The Chrome User Experience Report (CrUX) is Google’s dataset of real-world performance metrics collected from Chrome users who opted in to sharing their data. CrUX is the source of the field data shown in PageSpeed Insights and Google Search Console’s Core Web Vitals report.