Your website is live. But do you know who’s visiting it from Google? Do you even know whether Google can find all your pages? Google Search Console answers both questions. It connects directly to Google’s own data, it’s completely free, and it tells you things no paid SEO tool can replicate.
This guide covers everything: how to set up Google Search Console, how to verify your site, how to submit a sitemap, and how to read the reports that actually move your rankings. No technical background required.
Table of Contents
What Is Google Search Console?
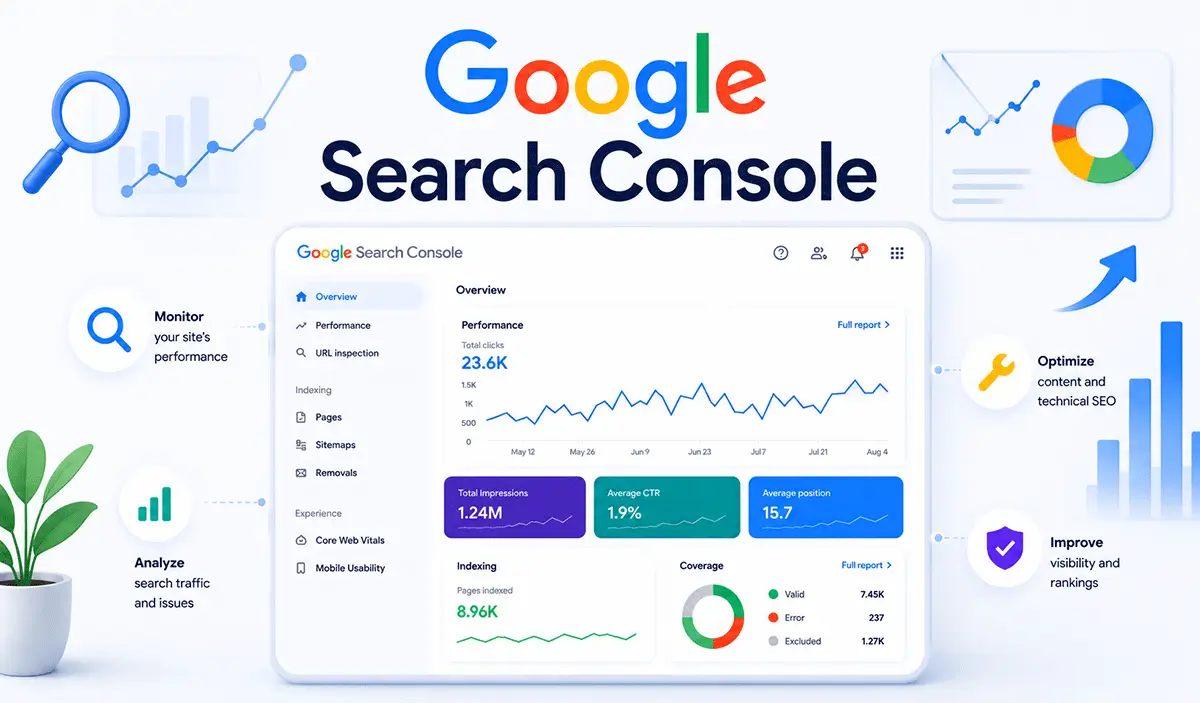
Google Search Console (GSC) is a free tool from Google that shows you how your website performs in Google Search. It gives you data on which search queries bring visitors to your site, which pages are indexed, how fast your pages load on mobile and desktop, and whether Google has flagged any problems you need to fix.
Google Search Console is a free tool from Google that lets website owners monitor how their site appears in Google Search. It shows which keywords drive traffic, which pages are indexed, and whether Google has flagged any technical or quality issues, all without requiring a paid subscription.
GSC replaced an older product called Google Webmaster Tools. The name changed in 2015, but the core purpose stayed the same: give website owners a direct line into how Google sees and handles their site.
Is Google Search Console Free?
Yes, completely. There’s no paid tier, no trial period, and no upgrade option. A Google account is the only requirement. You can add up to 1,000 website properties to a single GSC account.
Google Search Console vs Google Analytics: What’s the Difference?
These two tools get confused all the time. Here’s the clean version.
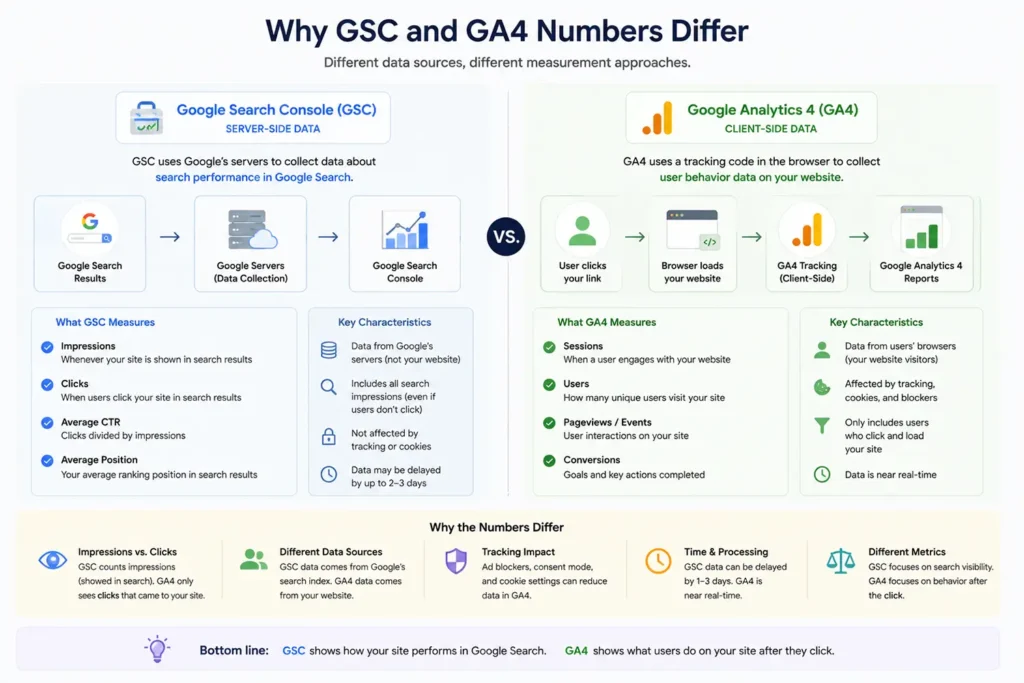
Google Search Console focuses on how Google discovers and interacts with your site. It shows data from Google’s own servers: the search queries that triggered impressions, which pages are indexed, and any technical errors Google found while crawling.
Google Analytics (GA4) focuses on what happens after someone arrives on your site. It tracks pageviews, session duration, bounce rates, conversions, and user behavior paths.
One thing beginners consistently get wrong: the click numbers in GSC and the session numbers in GA4 will never match exactly. That’s normal. GSC reads from Google’s search infrastructure on the server side. GA4 reads from JavaScript running on your pages on the client side. A gap between the two numbers is not a sign that either tool is broken. It’s a reflection of how differently each tool counts the same event.
Use both. GSC tells you how to get people to your website. GA4 tells you what they do once they arrive.
Google Search Console Setup: How to Add Your Website
The full setup takes about 10 minutes. Here is the exact process.
Step 1: Sign In with a Google Account
Go to Google Search Console and sign in. Use the Google account connected to your other Google tools where possible. It makes linking GSC to GA4 and Google Ads easier later.
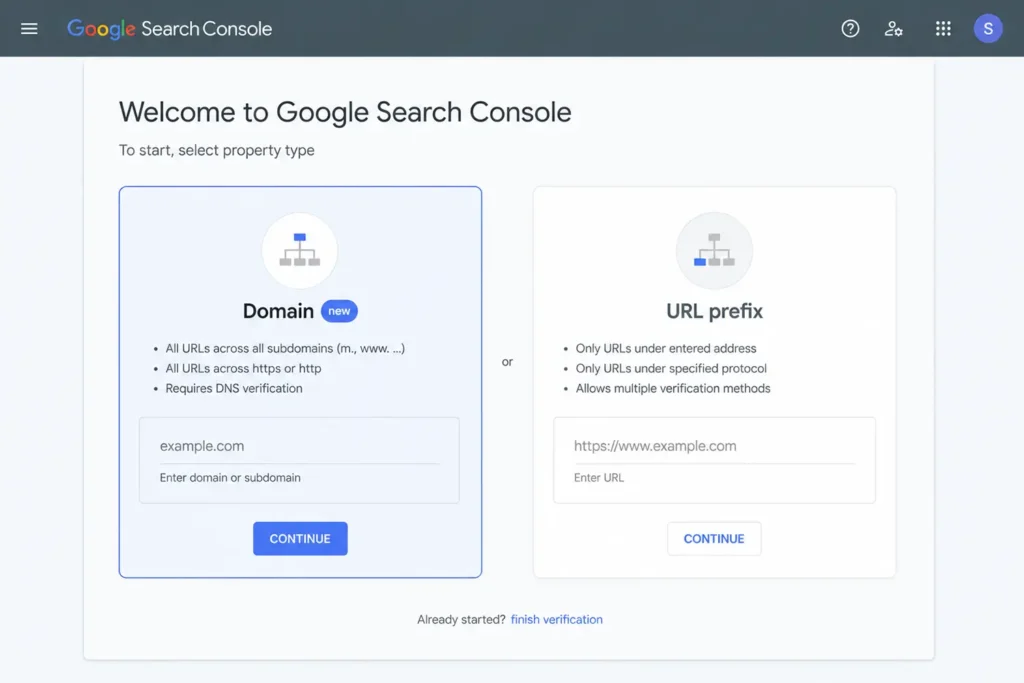
Step 2: Choose Your Property Type
This is the step most beginners rush past. GSC gives you two ways to add a website. Getting this right from the start saves real headaches later.
Domain property covers your entire domain and every variation of it: http, https, www, non-www, and all subdomains. One property captures all your traffic regardless of how your URLs are structured. This is the recommended choice for most websites. Verification requires adding a DNS TXT record through your domain registrar.
URL prefix property covers only the exact URL you enter, including the specific protocol and subdomain. It’s simpler to verify but gives a narrower, more fragmented view. Use this only if you specifically need to track a subdomain or subfolder separately.
For most business owners, bloggers, and marketers: choose the domain property. It’s more complete and avoids the problem of your traffic being split across multiple properties.
Step 3: Verify Website in Google Search Console
After choosing a property type, GSC needs you to prove you own the site. This is called ownership verification.
For domain properties, the only method is adding a DNS TXT record. Log into your domain registrar (GoDaddy, Namecheap, Cloudflare, or whoever manages your domain), find the DNS settings, and add the TXT record Google provides. DNS changes can take anywhere from a few minutes to several hours to take effect.
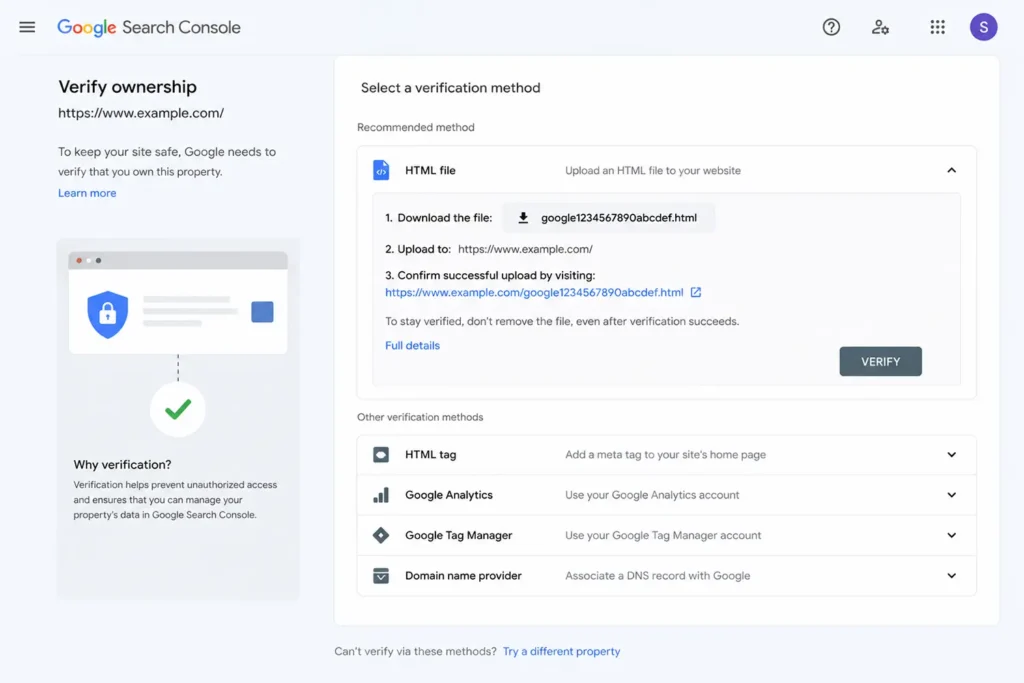
For URL prefix properties, you have five options:
- HTML file: Download a small verification file from GSC and upload it to your website’s root directory. Then return to GSC and click Verify.
- HTML tag: Copy a meta tag from GSC and add it to the
<head>section of your homepage. WordPress users with Yoast SEO can paste this directly into Yoast under SEO > General > Webmaster Tools. - Google Analytics: If GA4 is already installed on your site, GSC can verify through your existing Analytics code.
- Google Tag Manager: Same principle. If GTM is live on the site, use it for verification.
- DNS record: Same approach as domain property verification.
For WordPress websites, the HTML tag method through Yoast SEO is the fastest route. For non-WordPress websites, the HTML file method is reliable and simple.
Once verified, data collection starts immediately. Initial data typically appears within two to three days. For brand-new sites with minimal crawl activity, it may take longer.
Step 4: Manage Users and Permissions
GSC lets you give other people access to your property without sharing your personal Google credentials. Go to Settings > Users and permissions to manage this.
There are three permission levels:
Owner: Full access. Can view all data, use every tool, and manage other users. The person who verified the property is automatically an owner.
Full User: Can see all data and use most tools. Cannot change permissions or add new users.
Restricted User: Limited view-only access.
For an SEO agency or external consultant, Full User access is the right level. They get everything they need to do the work without the ability to add or remove other users.
How to Submit a Sitemap to Google Search Console
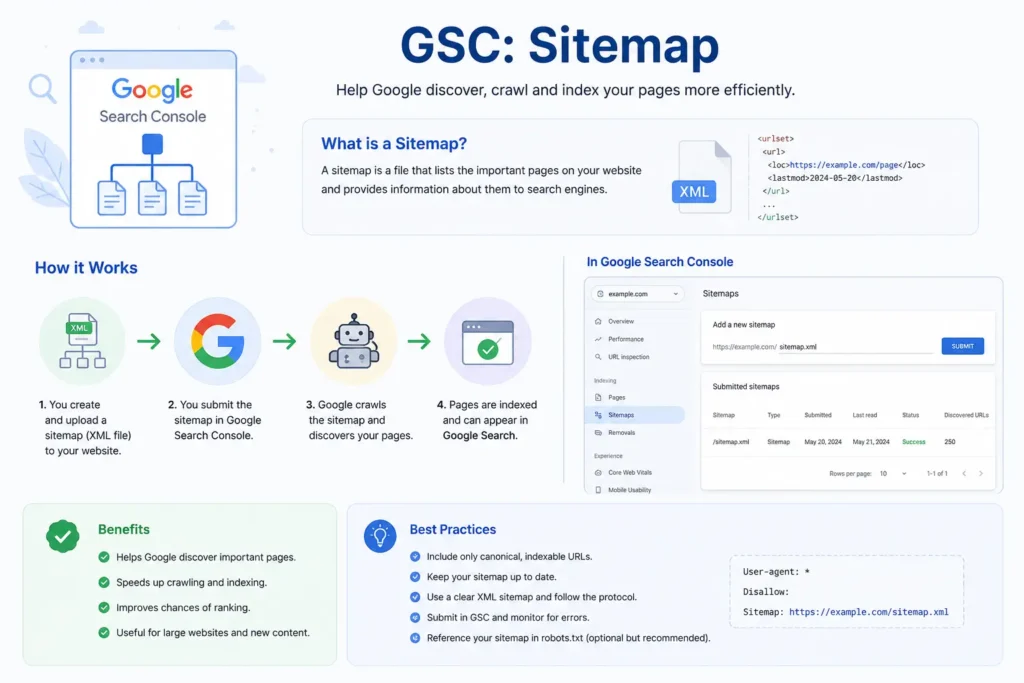
A sitemap is an XML file that lists all the important pages on your website. Submitting it through GSC tells Google exactly where your content lives, which speeds up indexing.
Do You Need a Sitemap?
Not always. Small sites where every page is reachable by following links from the homepage are usually found without one. For larger sites, new sites, or sites with pages that aren’t well-connected internally, a sitemap makes a meaningful difference in how quickly Google discovers and indexes new content.
Most modern platforms generate sitemaps automatically. WordPress with Yoast/RankMath SEO creates one at yoursite.com/sitemap_index.xml. Shopify, Wix, and Squarespace all do the same.
Submitting Your Sitemap
In GSC, go to Indexing > Sitemaps in the left sidebar. Enter the path to your sitemap file (typically sitemap.xml or sitemap_index.xml) and click Submit.
GSC then shows you whether Google has processed the sitemap, how many URLs were submitted, and how many were indexed. A mismatch between those two numbers is your first signal that some pages aren’t being indexed. The Index Coverage report (covered below) explains why.
Understanding the Key Google Search Console Reports
Once your site is verified and your sitemap is submitted, these are the reports that drive real SEO decisions.
The Search Performance Report
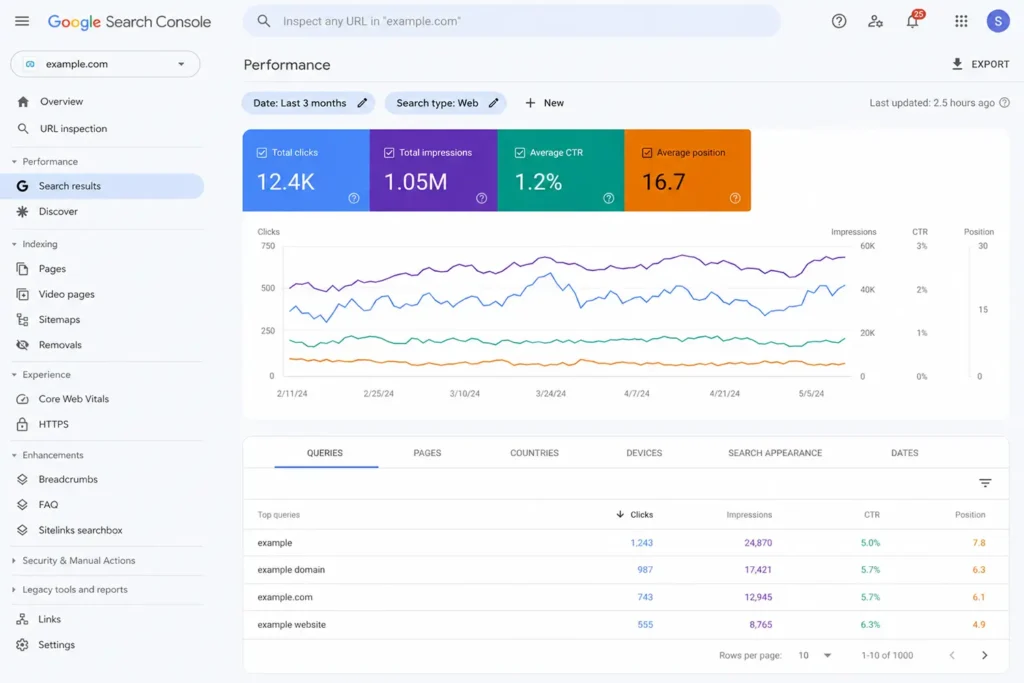
The Performance report is the one you’ll open most often. It shows how your site performs in Google Search across a date range of up to 16 months. As of December 2025, GSC also added weekly and monthly aggregation views alongside the standard daily data, which smooth out fluctuations and make longer-term trends easier to read.
The Search Performance report shows four metrics for every page on your site: total clicks, total impressions, average click-through rate (CTR), and average position. Together, these tell you which pages are visible in Google, which are earning clicks, and where the biggest gaps are between visibility and traffic.
Total clicks: How many times a user clicked through to your site from a Google search result.
Total impressions: How many times your pages appeared in search results, regardless of whether anyone clicked.
Average CTR: The percentage of impressions that converted to clicks. A page with 1,000 impressions and 50 clicks has a 5% CTR.
Average position: The average ranking position across all the queries that triggered an impression. Position 1 is the top result. Lower numbers are better.
You can filter all four metrics by query, page, country, device, and date. That filter functionality is where the real insight begins.
What to Do with This Data
Sort pages by impressions and look for low CTR. A page with 5,000 impressions and a 1% CTR is being seen but not clicked. The content is ranking, but the title tag or meta description isn’t compelling enough to earn the visit. Update both and watch CTR improve.
A Backlinko/Semrush study of 4 million search results found position 1 averages around 27.6% CTR, while position 3 drops to around 10%. On SERPs with AI Overviews, those numbers are lower. GrowthSRC data from 2025 shows position 1 CTR dropped to around 19% as AI Overviews expanded. Either way, the gap between page one positions is significant. CTR optimization is one of the fastest ways to grow traffic without changing rankings at all.
Look for pages sitting in positions 6 to 15. A small improvement in rankings can move them onto page one where clicks increase sharply. A content update, stronger internal linking, or a few new backlinks can be enough. These are your quick wins.
How to Find Keywords in Search Console
Click the Queries tab inside the Performance report. This shows every search term that triggered an impression for your site. Sort by impressions to see what you’re visible for. Sort by clicks to see what’s actually bringing people in. Filter by a specific page to see exactly which queries are landing people on that page. This is useful for content optimization and for finding keyword opportunities you didn’t deliberately target.
The Index Coverage Report
This report shows which pages on your site Google has indexed and which it hasn’t, grouped by the reason.
The Index Coverage report categorizes every page Google has discovered into four statuses: Valid (indexed), Error (indexing failed), Warning (indexed with issues), and Excluded (not indexed, often intentionally). Reviewing this report regularly helps you catch crawl errors before they silently pull pages out of search results.
Valid: The page is indexed. No action needed.
Error: Google tried to index the page and failed. Common causes include server errors (5xx codes), redirect loops, or pages accidentally blocked by robots.txt.
Warning: The page is indexed but has a flagged issue, such as a page with a conflicting noindex tag that Google indexed anyway.
Excluded: Google chose not to index the page. This isn’t always a problem. Pages deliberately set to noindex (thank-you pages, admin pages, duplicate content pages) should be excluded. Pages showing “Discovered, currently not indexed” or “Crawled, currently not indexed” may need attention, particularly if they’re pages you want ranking.
How to Fix Index Coverage Errors
Click on any error type to see the affected URLs. Then use the URL Inspection tool to investigate each one. The most common fixes involve removing accidental noindex tags, resolving server errors with your hosting provider, and cleaning up redirect chains that confuse Googlebot.
Indexing issues live at the heart of technical SEO. A page that isn’t indexed won’t rank, no matter how strong the content is.
The URL Inspection Tool
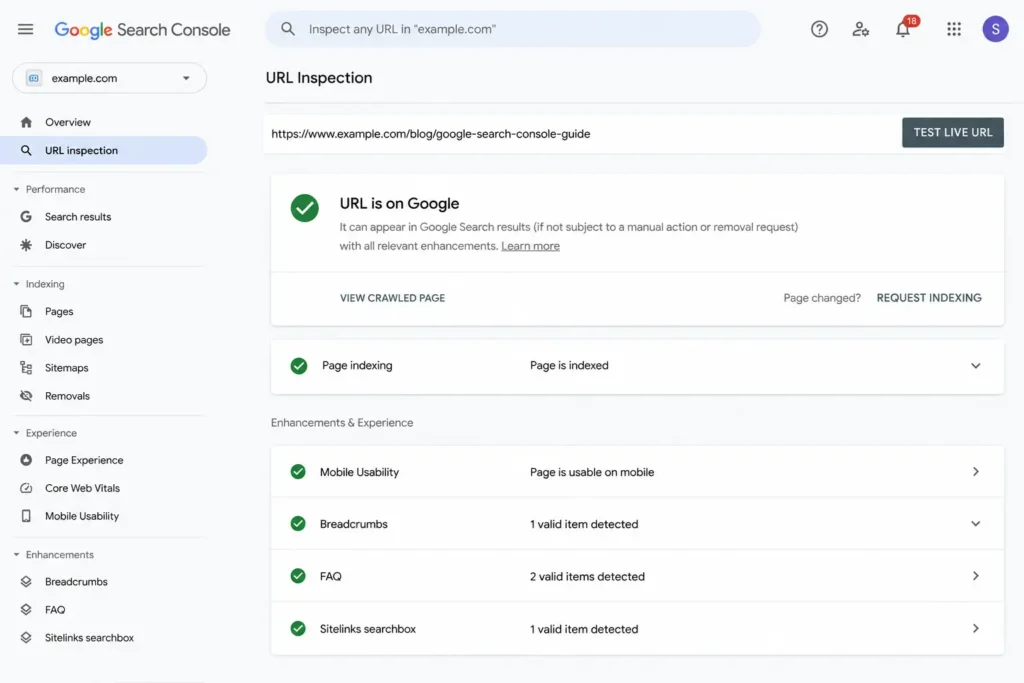
The URL Inspection tool lets you check exactly how Google sees any specific page on your site. Type a URL into the search bar at the top of GSC and press Enter.
The tool returns:
- Whether the page is currently indexed
- When Google last crawled it
- Which canonical URL Google recognizes
- Whether any structured data (schema markup) is present and valid
- Whether the page qualifies for rich results
- Any specific indexing or usability issues with that page
After publishing a new page, use the URL Inspection tool to request indexing. Click “Request Indexing” and Google typically crawls the page faster than it would through normal discovery. It’s not instantaneous, but it’s the fastest legitimate method available.
This is also the tool to use when a specific page has dropped in rankings, stopped appearing in results, or is showing the wrong canonical URL.
Core Web Vitals
Core Web Vitals are Google’s page experience metrics. Google made these a ranking factor in May 2021, and they remain one of the clearest direct signals in GSC about how your pages perform for real users.
Core Web Vitals measure three aspects of user experience: Largest Contentful Paint (LCP) tracks how quickly the main content loads; Cumulative Layout Shift (CLS) measures visual stability as the page loads; and Interaction to Next Paint (INP) measures how quickly the page responds to user inputs. Google replaced the older First Input Delay (FID) metric with INP in March 2024.
GSC reports Core Web Vitals separately for mobile and desktop. Pages fall into three bands: Good, Needs Improvement, and Poor. The goal is moving as many pages as possible into the Good band.
When a page is flagged as Poor or Needs Improvement, click through to see which metric is failing. Then use Google PageSpeed Insights to get specific technical recommendations. Common fixes include compressing images, reducing render-blocking scripts, and improving server response times.
Manual Actions
A manual action means a human reviewer at Google identified a quality problem on your site and applied a penalty directly. This is different from an algorithmic filter. It’s a deliberate decision that your site violated Google’s quality guidelines.
Manual actions are serious. They can suppress specific pages or your entire site from search results. Go to Security and Manual Actions > Manual Actions in GSC. If it shows “No issues detected,” you’re clear.
If a manual action exists, the report describes the problem specifically. Common reasons include spammy or thin content, manipulative link patterns, hidden text, or cloaking. Fix the underlying issue, then submit a reconsideration request through GSC.
The Links Report
The Links report shows who links to your site from other websites (external links) and how your own pages link to each other (internal links).
For external links, the report identifies your most-linked pages and the domains sending the most backlinks. These are your highest-authority pages. They’re the most worth refreshing, expanding, and building internal links toward.
For internal links, the report shows which pages receive the most internal links from your own site. A key service page with very few internal links isn’t getting the authority it deserves. Add internal links pointing to it from relevant blog posts and related content. This is one of the simplest, highest-ROI moves in on-page SEO.
The Enhancements Reports
Schema markup on your pages can qualify them for rich results: the enhanced search listings that display ratings, FAQs, pricing, or other details directly in search results. Rich results typically earn higher CTRs than standard blue links.
The Enhancements reports in GSC show whether Google can read your structured data correctly. Any errors or warnings appear here with the affected URLs. Fix the issue, validate the fix using Google’s Rich Results Test, then click “Validate Fix” in GSC to notify Google.
One important note: as of May 7, 2026, Google removed FAQ rich results from search. FAQ schema is still valid for other purposes, but it no longer generates expandable FAQ snippets in search results.
Security Issues
The Security Issues report flags hacking, malware, and deceptive content Google has detected on your website. Act on any flag here immediately. Google can remove your site from search results entirely until the issue is resolved.
For most business sites with basic security practices in place, this report stays clean. But check it periodically, especially after any sudden unexplained drop in traffic.
New Google Search Console Features in 2025 and 2026
Most guides covering this topic haven’t kept up with recent changes. Here’s what’s new and why it matters.
Search Console Insights: Fully Integrated (June 2025)
In June 2025, Google moved Search Console Insights from its standalone beta into the main GSC dashboard. The Insights panel now lives inside your regular GSC account and surfaces the most important content-level signals without requiring you to dig through multiple reports. You get trending queries, new and lost rankings, top-performing content, and a traffic source overview in one view.
For anyone doing a quick weekly check, Insights is now the right starting point before opening the full Performance report.
24-Hour Performance View (December 2024)
GSC now shows hourly data for the most recent 24 hours. This is useful immediately after publishing a new page, pushing a significant content update, or making a technical change. You can monitor early traffic signals without waiting two days for the standard data to populate.
AI-Powered Report Configurator (December 2025)
Google added natural-language controls to the Performance report in December 2025. You can type prompts like “show me queries where impressions are rising but clicks are flat” and GSC automatically builds the matching report view. For users who previously had to manually stack filters to find specific data patterns, this is a meaningful time-saver.
Impression Data Note (May 2025 to April 2026)
Google confirmed a logging error that inflated impression counts across all GSC properties from May 13, 2025 through April 27, 2026. Clicks were not affected. Impressions, CTR, and average position were all affected because CTR and average position are calculated from impressions. If your impressions dropped sharply in late April or early May 2026, you likely observed the fix taking effect, not a real change in your search performance.
How to Connect Search Console to Google Analytics
Linking GSC with GA4 gives you search performance data and on-site behavior data in the same place. You can see not just how many people clicked to a page, but what they did after they arrived.
In GA4, go to Admin > Property Settings > Search Console Links. Select your verified GSC property and confirm. Once linked, a Search Console section appears in GA4 under Reports > Acquisition, showing organic landing page data alongside engagement metrics like bounce rate and time on page.
This setup is particularly valuable for spotting intent mismatches. A page receiving 500 organic clicks per month but showing a 90% bounce rate signals that the content isn’t matching what searchers expected to find. GSC tells you they clicked. GA4 tells you they left immediately. Together, those two facts point directly to what needs fixing.
The future of SEO makes this integration even more relevant. As AI answers and zero-click searches grow, the pages that do earn clicks need to hold those visitors. That’s where GA4 and GSC together give you the complete picture.
Common Questions About Google Search Console
How do I check my website ranking on Google?
Open the Performance report, click the Pages tab, select a specific page, then click Queries. You’ll see every search term that page ranks for and the average position for each. Keep in mind that the position reflects an average across many searches, devices, and locations, so it may differ from what you see searching manually from your own device.
Why is Google Search Console not showing data?
The most common causes: the property was recently verified and data hasn’t accumulated yet (expect two to three days for a new property), the URL format entered during setup was wrong (http versus https matters for URL prefix properties), or Google hasn’t crawled the site enough yet. For new sites, submitting a sitemap and requesting indexing through the URL Inspection tool accelerates the process.
How do I remove a URL from Google?
Go to Indexing > Removals in GSC. Submit the URL you want removed from search results. Removals last approximately six months. They’re a temporary measure while you arrange a permanent solution, such as adding a noindex tag or deleting the page and setting a redirect.
What is the Search Console data delay?
GSC applies a standard two-day delay to search data. Activity from today appears in your reports in two days. The 24-hour view is the exception, showing near-real-time hourly data for the current period.
Is Google Search Console completely free?
Yes. No trial period, no subscription, and no premium upgrade path. Your Google account is all you need.
What is the Google Search Console API?
The Search Console API lets developers pull GSC data programmatically into custom dashboards, automated reports, and BI tools. It requires basic developer knowledge to set up and is available through Google’s developer documentation. Most non-technical users don’t need it. The GSC interface handles the same data visually.
What is domain property vs URL prefix in Google Search Console?
A domain property covers your entire website across all protocols and subdomains. A URL prefix property covers only the specific URL you enter. Domain properties are recommended for most users because they give a complete, unified view of your site’s search performance.
What to Do After Setting Up Google Search Console
GSC provides the data. Your job is to act on it.
A monthly review routine that covers the most important checks:
Open the Performance report and sort pages by impressions. Look for high-impression, low-CTR pages. Update the title tags and meta descriptions on those pages to be more compelling.
Check the Index Coverage report for new errors. Investigate any pages that should be indexed but aren’t showing as Valid.
Review Core Web Vitals for pages that have moved into the Poor band. Prioritize fixing the pages with the highest organic traffic first, since fixing a high-traffic page has more immediate impact.
Check Manual Actions and Security Issues. Both should be clean. Flag anything that isn’t and deal with it immediately.
Use the Links report to identify your most-linked pages. Build more content around those topics and strengthen your internal linking toward your most important pages.
For anyone just getting started, the Performance report and Index Coverage report are the right starting points. Those two alone surface most of the impactful opportunities. Add the other reports once you’re comfortable with the basics.
The underlying logic of what SEO actually is runs through all of this. GSC gives you the signals. Understanding what Google rewards tells you which signals to prioritize.
For local business owners, the Performance report filtered by location is particularly useful. Combine those insights with a strong local SEO strategy and you have a clear picture of how your site performs for nearby customers.
Final Thoughts
Google Search Console is the most honest feedback source your website has. It reads directly from Google’s infrastructure, not from estimates or third-party approximations. For any business serious about organic search, it’s the starting point, not an afterthought.
Set it up now. Verify your website, submit your sitemap, and check back in a week. The data will be there. From that point, every decision gets a little clearer.
Not sure what your GSC data is telling you, or where to focus first? Get in touch with the Rankiwis team and we’ll take a look.
Frequently Asked Questions
What is Google Search Console used for?
Google Search Console is a free tool that helps website owners monitor their site’s visibility in Google Search. It shows which pages are indexed, which keywords bring traffic, and whether there are technical or quality issues affecting rankings.
How do I add my website to Google Search Console?
Go to search.google.com/search-console, sign in with a Google account, click Add Property, choose either Domain or URL Prefix, and complete the verification steps. The full process typically takes under 15 minutes.
Does Google Search Console improve SEO?
Not directly. GSC shows you what’s happening with your site in Google Search. Acting on that data improves SEO. Fixing indexing errors, raising CTRs through better titles and descriptions, updating underperforming pages, and monitoring Core Web Vitals are all improvements you make based on what GSC reveals.
How long does Google Search Console take to show data?
A newly verified property typically shows data within two to three days. GSC also applies a standard two-day delay to all search data, so today’s activity appears in reports in two days. The 24-hour view shows more recent hourly data.
What is the difference between domain property and URL prefix in Google Search Console?
A domain property covers your entire website across all protocols and subdomains, giving you a unified view. A URL prefix property covers only the specific URL you enter. Domain properties are recommended for most users.
Can Google Search Console show me all the keywords my site ranks for?
GSC shows all the queries that triggered impressions for your site over the last 16 months, not just the keywords you targeted. This makes it one of the best free keyword discovery tools available. Use the Queries tab in the Performance report to see the full list.